
Seller's Agent in 2020
Sinta Fuhrmann
Better Homes and Gardens Real Estate Gary Greene - West Gray
(281) 486-1900
4 in this area
8 Total Sales


Estimated Value: $561,845 - $641,000
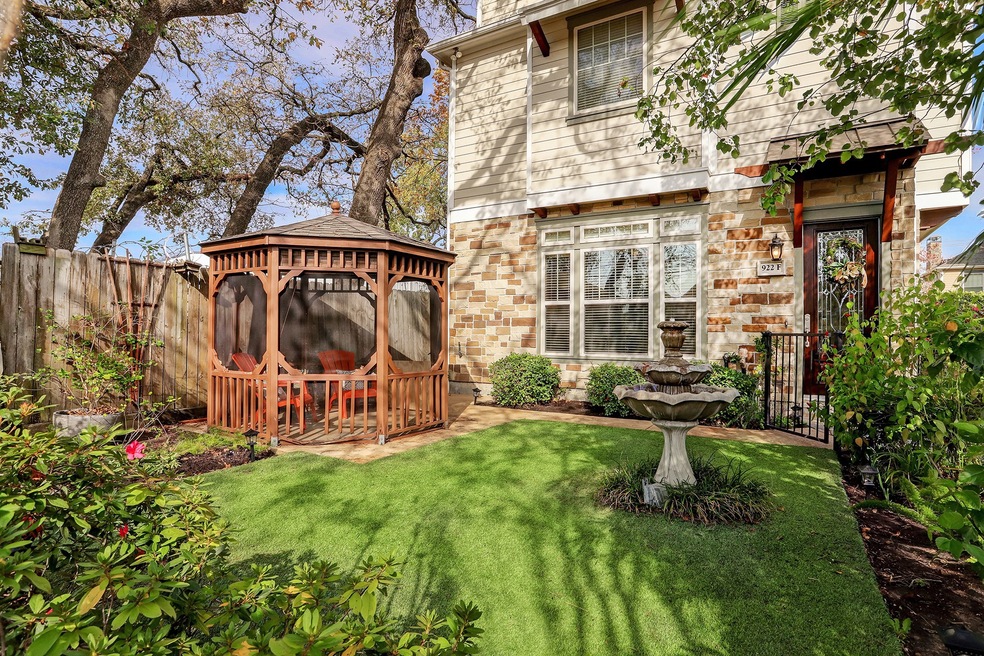
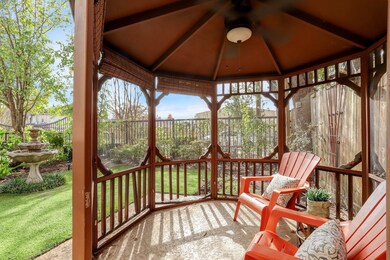
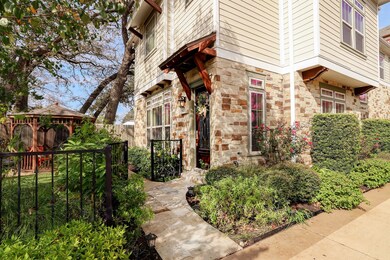
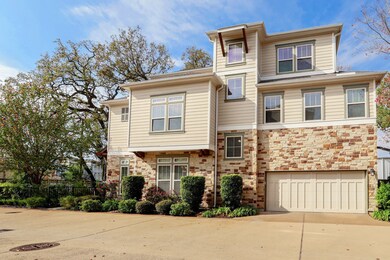
This beautiful corner home and yard belongs in a Better Homes & Gardens Magazine! Enjoy the ease of 1st-floor living, built-in speakers, oversized bedrooms & walk-in closets, tankless water heater & other energy-efficient features awarding this home its green certificates & a quality you can feel. The master features two incredible walk-in closets--one leads directly to the utility room! Four bedrooms plus a bonus landing area for a study/library. Rare opportunity to live in a private gated community like this by David Weekley with a quality that differentiates from new construction. Neighbors are separated by a double-wide driveway & fenced yards between each home. Fantastic central location walking distance to Garden Oaks Elementary, popular restaurants, breweries, wine bars & at least 4 new developments nearby getting a lot of press! Fully loaded with blinds and appliances--just move right in! Stop by the open house!
Last Agent to Sell the Property
Better Homes and Gardens Real Estate Gary Greene - West Gray License #0625204 Listed on: 12/05/2019
| Date | Buyer | Sale Price | Title Company |
|---|---|---|---|
| Turner George Andrew | -- | None Listed On Document | |
| Scott Erik Douglas | -- | Texas American Title Company | |
| Wood Lisa D | -- | Priority Title Co |
| Date | Status | Borrower | Loan Amount |
|---|---|---|---|
| Previous Owner | Scott Erik Douglas | $384,400 | |
| Previous Owner | Wood Lisa D | $326,282 |
| Date | Event | Price | List to Sale | Price per Sq Ft |
|---|---|---|---|---|
| 01/27/2025 01/27/25 | Off Market | -- | -- | -- |
| 02/21/2020 02/21/20 | Sold | -- | -- | -- |
| 01/22/2020 01/22/20 | Pending | -- | -- | -- |
| 12/05/2019 12/05/19 | For Sale | $480,000 | -- | $176 / Sq Ft |
| Year | Tax Paid | Tax Assessment Tax Assessment Total Assessment is a certain percentage of the fair market value that is determined by local assessors to be the total taxable value of land and additions on the property. | Land | Improvement |
|---|---|---|---|---|
| 2025 | $8,274 | $541,959 | $181,753 | $360,206 |
| 2024 | $8,274 | $548,040 | $125,829 | $422,211 |
| 2023 | $8,274 | $495,662 | $111,848 | $383,814 |
| 2022 | $10,200 | $463,245 | $111,848 | $351,397 |
| 2021 | $11,101 | $476,318 | $111,848 | $364,470 |
| 2020 | $11,424 | $471,767 | $111,848 | $359,919 |
| 2019 | $11,127 | $439,730 | $111,848 | $327,882 |
| 2018 | $6,124 | $426,872 | $111,848 | $315,024 |
| 2017 | $13,047 | $516,000 | $111,848 | $404,152 |
| 2016 | $13,883 | $558,500 | $111,848 | $446,652 |
| 2015 | $9,200 | $504,635 | $83,886 | $420,749 |
| 2014 | $9,200 | $477,553 | $83,886 | $393,667 |
Seller's Agent in 2020
Sinta Fuhrmann
Better Homes and Gardens Real Estate Gary Greene - West Gray
(281) 486-1900
4 in this area
8 Total Sales
Buyer's Agent in 2020
Angela Longo
Compass RE Texas, LLC - Memorial
(713) 899-5648
1 in this area
22 Total Sales
Source: Houston Association of REALTORS®
MLS Number: 3183244
APN: 0630630170006
Disclaimer: Certain information contained herein is derived from information provided by parties other than Homes.com. All information provided is deemed reliable, but is not guaranteed to be accurate and should be independently verified.
![]() Copyright 2025, Houston REALTORS® Information Service, Inc.
Copyright 2025, Houston REALTORS® Information Service, Inc.
The information provided is exclusively for consumers’ personal, non-commercial use, and may not be used for any purpose other than to identify prospective properties consumers may be interested in purchasing.
Information is deemed reliable but not guaranteed.