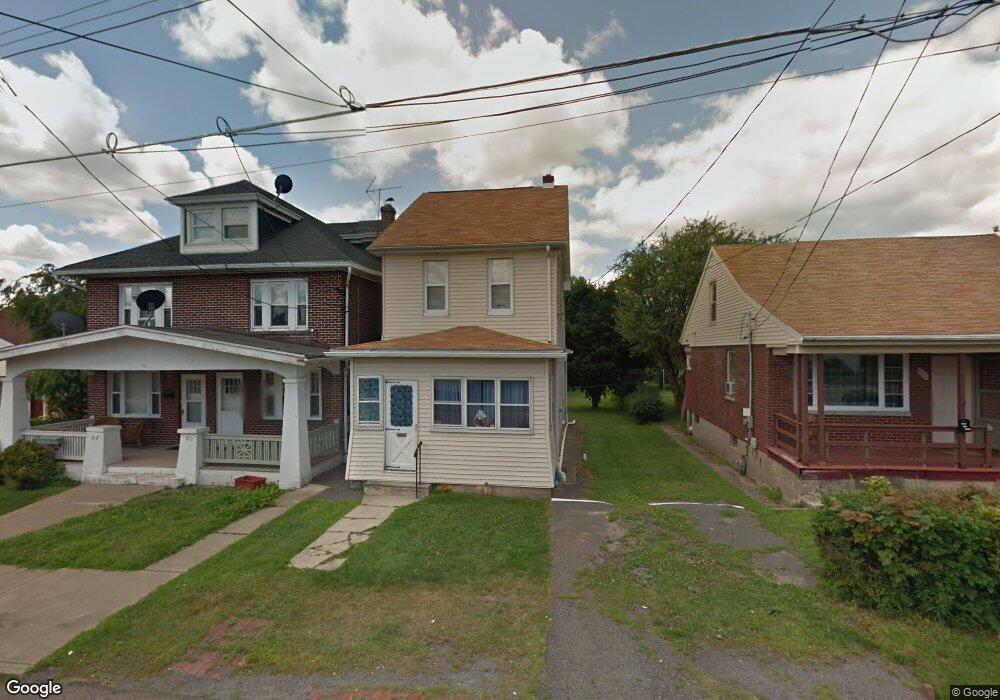
922 Grant St Hazleton, PA 18201
Estimated Value: $163,984 - $199,000
2
Beds
2
Baths
1,224
Sq Ft
$146/Sq Ft
Est. Value
About This Home
This home is located at 922 Grant St, Hazleton, PA 18201 and is currently estimated at $178,746, approximately $146 per square foot. 922 Grant St is a home located in Luzerne County with nearby schools including Hazleton Area High School, Immanuel Christian School, and Bishop Hafey Junior/Senior High School.
Ownership History
Date
Name
Owned For
Owner Type
Purchase Details
Closed on
May 31, 2016
Sold by
Simonelli Mary Ann and Soroko Theresa
Bought by
Bather Riqeidy A Mejia
Current Estimated Value
Home Financials for this Owner
Home Financials are based on the most recent Mortgage that was taken out on this home.
Original Mortgage
$43,650
Outstanding Balance
$26,248
Interest Rate
3.61%
Mortgage Type
New Conventional
Estimated Equity
$152,498
Purchase Details
Closed on
Jan 1, 1960
Bought by
Simonelli Angelo Ux Mary Ann
Create a Home Valuation Report for This Property
The Home Valuation Report is an in-depth analysis detailing your home's value as well as a comparison with similar homes in the area
Home Values in the Area
Average Home Value in this Area
Purchase History
| Date | Buyer | Sale Price | Title Company |
|---|---|---|---|
| Bather Riqeidy A Mejia | $45,000 | None Available | |
| Simonelli Angelo Ux Mary Ann | -- | -- |
Source: Public Records
Mortgage History
| Date | Status | Borrower | Loan Amount |
|---|---|---|---|
| Open | Bather Riqeidy A Mejia | $43,650 |
Source: Public Records
Tax History
| Year | Tax Paid | Tax Assessment Tax Assessment Total Assessment is a certain percentage of the fair market value that is determined by local assessors to be the total taxable value of land and additions on the property. | Land | Improvement |
|---|---|---|---|---|
| 2026 | $1,452 | $70,700 | $24,000 | $46,700 |
| 2025 | $2,031 | $70,700 | $24,000 | $46,700 |
| 2024 | $1,903 | $70,700 | $24,000 | $46,700 |
| 2023 | $1,779 | $70,700 | $24,000 | $46,700 |
| 2022 | $1,766 | $70,700 | $24,000 | $46,700 |
| 2021 | $1,725 | $70,700 | $24,000 | $46,700 |
| 2020 | $1,541 | $70,700 | $24,000 | $46,700 |
| 2019 | $1,590 | $70,700 | $24,000 | $46,700 |
| 2018 | $1,536 | $70,700 | $24,000 | $46,700 |
| 2017 | $1,416 | $70,700 | $24,000 | $46,700 |
| 2016 | $621 | $70,700 | $24,000 | $46,700 |
| 2015 | $589 | $70,700 | $24,000 | $46,700 |
| 2014 | $589 | $70,700 | $24,000 | $46,700 |
Source: Public Records
Map
Nearby Homes
- 829 W 21st St
- 1087 Lafayette Ct
- 897 N Vine St
- 60 E Jefferson Ave
- 714 Alter St
- 0 Church Unit PALU2002778
- 403 W 7th St
- 118 E Green St
- 1 W Diamond Ave
- 397 W 30th St
- 218 North St
- 239 Lincalis St
- 991 Seybert St
- 911 Seybert St
- 14 W 4th St
- 328 W Green St
- 756 Seybert St
- 127 W Diamond Ave
- 187 N Church St
- 239 E 23rd St
Your Personal Tour Guide
Ask me questions while you tour the home.