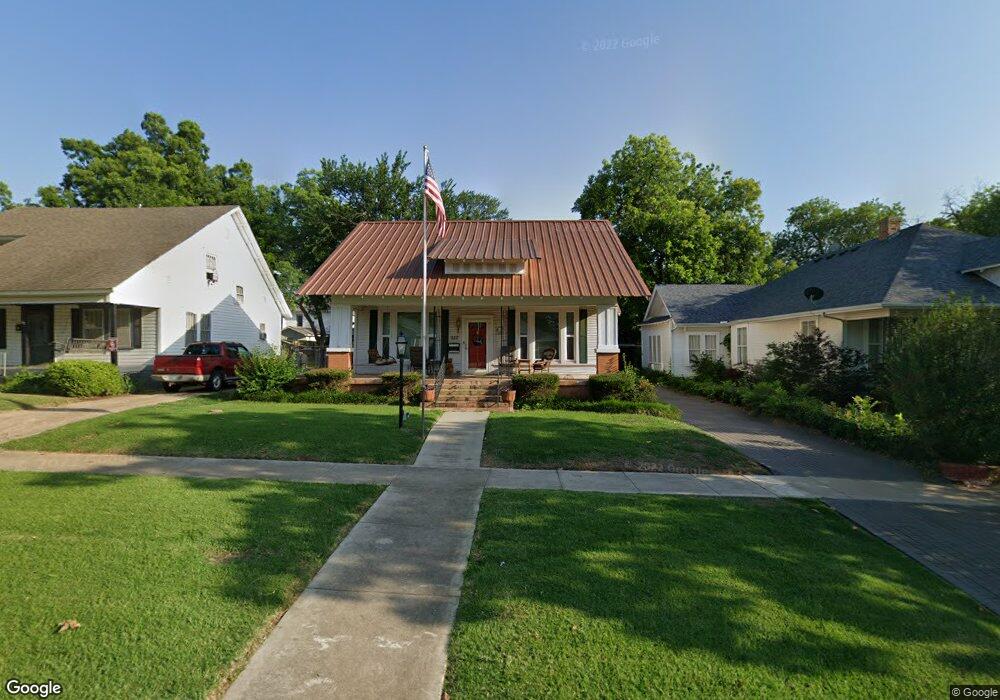
922 McLish St Ardmore, OK 73401
Estimated Value: $155,000 - $164,638
3
Beds
2
Baths
1,636
Sq Ft
$98/Sq Ft
Est. Value
About This Home
This home is located at 922 McLish St, Ardmore, OK 73401 and is currently estimated at $160,660, approximately $98 per square foot. 922 McLish St is a home located in Carter County with nearby schools including Lincoln Elementary School, Ardmore Middle School, and Ardmore High School.
Ownership History
Date
Name
Owned For
Owner Type
Purchase Details
Closed on
Jan 29, 2025
Sold by
Cope Donald Stanley
Bought by
Angel Linda
Current Estimated Value
Purchase Details
Closed on
Oct 14, 2020
Sold by
Taylor Meayrene
Bought by
Cope Donald Stan and Cope Donald S
Home Financials for this Owner
Home Financials are based on the most recent Mortgage that was taken out on this home.
Original Mortgage
$92,000
Interest Rate
2.8%
Mortgage Type
New Conventional
Purchase Details
Closed on
Jan 31, 2020
Sold by
Sturgeon Paula S and Flanagan Paula Sue
Bought by
Taylor Meayrene
Purchase Details
Closed on
Aug 18, 2008
Sold by
Brown Clifford D and Brown Margaret L
Bought by
Flanagan E Don and Flanagan Paula S
Purchase Details
Closed on
Nov 6, 1998
Sold by
Dolo, Inc
Bought by
Brown Clifford D
Purchase Details
Closed on
Oct 6, 1995
Sold by
Dolo, Inc
Bought by
Dolo, Inc
Create a Home Valuation Report for This Property
The Home Valuation Report is an in-depth analysis detailing your home's value as well as a comparison with similar homes in the area
Home Values in the Area
Average Home Value in this Area
Purchase History
| Date | Buyer | Sale Price | Title Company |
|---|---|---|---|
| Angel Linda | $150,000 | Arbuckle Closing & Escrow | |
| Angel Linda | $150,000 | Arbuckle Closing & Escrow | |
| Cope Donald Stan | $115,000 | Stewart Title Of Ok Inc | |
| Taylor Meayrene | $99,000 | Stewart Title Of Ok Inc | |
| Flanagan E Don | $80,000 | -- | |
| Brown Clifford D | -- | -- | |
| Dolo, Inc | $2,000 | -- |
Source: Public Records
Mortgage History
| Date | Status | Borrower | Loan Amount |
|---|---|---|---|
| Previous Owner | Cope Donald Stan | $92,000 |
Source: Public Records
Tax History Compared to Growth
Tax History
| Year | Tax Paid | Tax Assessment Tax Assessment Total Assessment is a certain percentage of the fair market value that is determined by local assessors to be the total taxable value of land and additions on the property. | Land | Improvement |
|---|---|---|---|---|
| 2024 | -- | $15,079 | $2,127 | $12,952 |
| 2023 | $0 | $14,641 | $2,061 | $12,580 |
| 2022 | $1,097 | $14,214 | $1,970 | $12,244 |
| 2021 | $0 | $13,800 | $1,800 | $12,000 |
| 2020 | $1,097 | $12,031 | $1,748 | $10,283 |
| 2019 | $1,037 | $11,681 | $1,698 | $9,983 |
| 2018 | $1,021 | $11,340 | $1,644 | $9,696 |
| 2017 | $915 | $11,011 | $1,597 | $9,414 |
| 2016 | $903 | $10,689 | $1,572 | $9,117 |
| 2015 | $720 | $10,378 | $1,088 | $9,290 |
| 2014 | $812 | $10,077 | $754 | $9,323 |
Source: Public Records
Map
Nearby Homes
- 1105 Bixby St
- 0 McLish Ave SW
- 1103 Stanley St SW
- 1013 W Main St
- 1206 Bixby St
- 822 Stanley St SW
- 1209 Stanley St SW
- 141 G St SW
- 0 N Commerce St Unit 2517610
- 0 N Commerce St Unit 2530001
- 711 3rd Ave SW
- 121 F St SW
- 606 W Broadway St
- 1301 3rd Ave SW
- 1306 McLish St
- 332 I St SW
- 1317 3rd Ave SW
- 1203 SW 4th
- 1424 Stanley St SW
- 420 K St SW