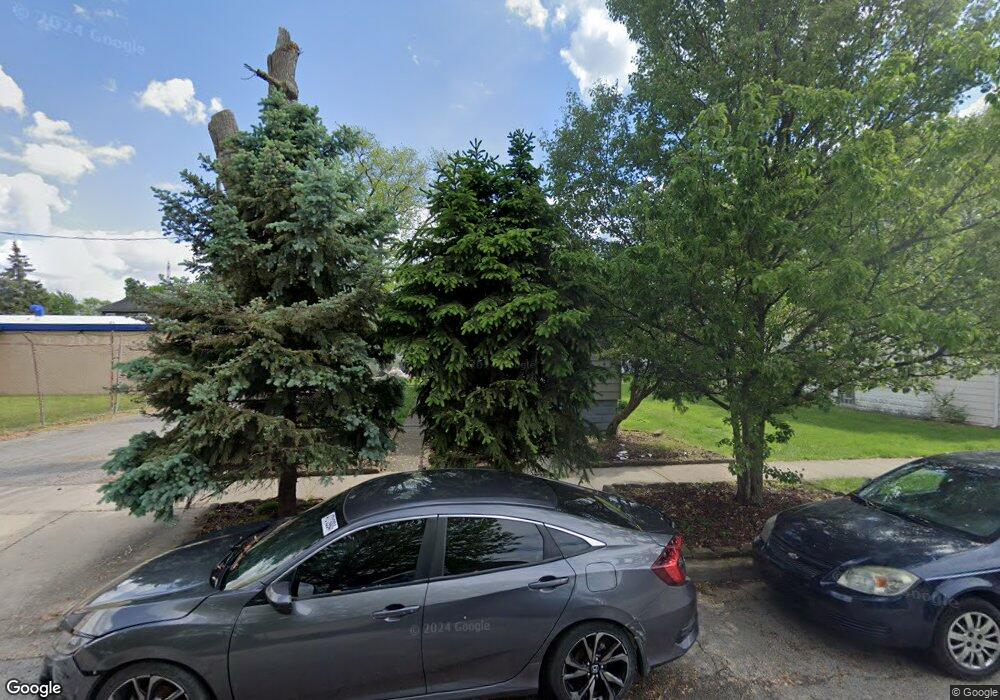
922 Morris St Hammond, IN 46320
Estimated Value: $124,798 - $201,000
4
Beds
1
Bath
1,148
Sq Ft
$146/Sq Ft
Est. Value
About This Home
This home is located at 922 Morris St, Hammond, IN 46320 and is currently estimated at $167,200, approximately $145 per square foot. 922 Morris St is a home located in Lake County with nearby schools including Maywood Elementary School, Eggers Middle School, and Hammond High School.
Ownership History
Date
Name
Owned For
Owner Type
Purchase Details
Closed on
Oct 22, 2019
Sold by
Quinteros Evelin B
Bought by
Nerio Francisca Ilma Ramirez De
Current Estimated Value
Purchase Details
Closed on
Aug 19, 2011
Sold by
Fifth Third Real Estate Llc
Bought by
Quinteros Evelin B
Purchase Details
Closed on
Aug 8, 2011
Sold by
Navy Federal Credit Union
Bought by
Nwi Investments Inc
Purchase Details
Closed on
May 6, 2011
Sold by
Buford Richard L and Mortgage Electronic Registrati
Bought by
Navy Federal Credit Union
Create a Home Valuation Report for This Property
The Home Valuation Report is an in-depth analysis detailing your home's value as well as a comparison with similar homes in the area
Home Values in the Area
Average Home Value in this Area
Purchase History
| Date | Buyer | Sale Price | Title Company |
|---|---|---|---|
| Nerio Francisca Ilma Ramirez De | -- | None Available | |
| Quinteros Evelin B | -- | Indiana Title Network Co | |
| Fifth Third Real Estate Llc | -- | Indiana Title Network Co | |
| Nwi Investments Inc | -- | Nta | |
| Navy Federal Credit Union | $21,160 | None Available |
Source: Public Records
Tax History Compared to Growth
Tax History
| Year | Tax Paid | Tax Assessment Tax Assessment Total Assessment is a certain percentage of the fair market value that is determined by local assessors to be the total taxable value of land and additions on the property. | Land | Improvement |
|---|---|---|---|---|
| 2024 | $3,781 | $89,000 | $17,100 | $71,900 |
| 2023 | $2,005 | $79,100 | $18,600 | $60,500 |
| 2022 | $2,005 | $74,800 | $18,600 | $56,200 |
| 2021 | $1,504 | $55,500 | $6,200 | $49,300 |
| 2020 | $1,261 | $46,200 | $6,200 | $40,000 |
| 2019 | $1,249 | $41,800 | $6,200 | $35,600 |
| 2018 | $1,322 | $40,100 | $6,200 | $33,900 |
| 2017 | $1,443 | $39,300 | $6,200 | $33,100 |
| 2016 | $1,171 | $36,700 | $6,200 | $30,500 |
| 2014 | $1,178 | $37,600 | $6,200 | $31,400 |
| 2013 | $1,067 | $36,000 | $6,200 | $29,800 |
Source: Public Records
Map
Nearby Homes