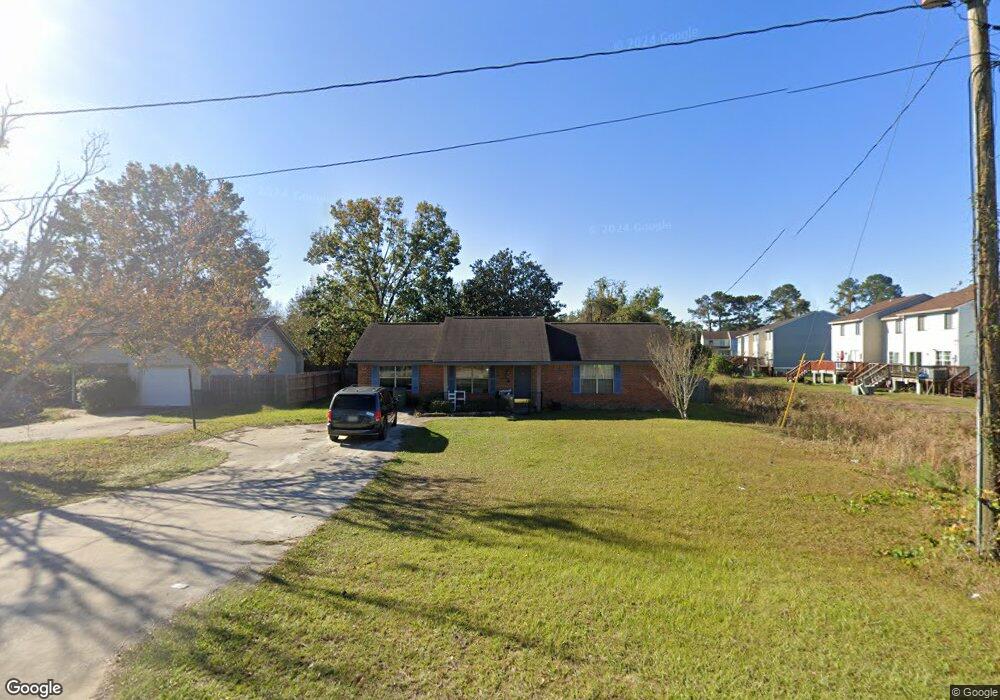
922 Pineland Ave Hinesville, GA 31313
Estimated Value: $157,000 - $177,521
3
Beds
2
Baths
1,200
Sq Ft
$138/Sq Ft
Est. Value
About This Home
This home is located at 922 Pineland Ave, Hinesville, GA 31313 and is currently estimated at $165,130, approximately $137 per square foot. 922 Pineland Ave is a home located in Liberty County with nearby schools including Waldo Pafford Elementary School, Snelson-Golden Middle School, and Bradwell Institute.
Ownership History
Date
Name
Owned For
Owner Type
Purchase Details
Closed on
Dec 7, 2018
Sold by
Sanchez Jarvis L
Bought by
Chastine Brandon M
Current Estimated Value
Home Financials for this Owner
Home Financials are based on the most recent Mortgage that was taken out on this home.
Original Mortgage
$81,496
Outstanding Balance
$72,253
Interest Rate
5.12%
Mortgage Type
FHA
Estimated Equity
$92,877
Purchase Details
Closed on
May 3, 2010
Sold by
Secretary Of Veterans Affairs
Bought by
Rogers Real Estate Holdings Lp
Purchase Details
Closed on
Nov 21, 2002
Sold by
Holtzman George W
Bought by
Sanchez Jarvis L and Sanchez Hillery A
Purchase Details
Closed on
Jul 9, 2002
Sold by
Webster Wanda
Bought by
Holtzman George W
Purchase Details
Closed on
Jul 20, 1990
Bought by
Webster Wanda
Create a Home Valuation Report for This Property
The Home Valuation Report is an in-depth analysis detailing your home's value as well as a comparison with similar homes in the area
Home Values in the Area
Average Home Value in this Area
Purchase History
| Date | Buyer | Sale Price | Title Company |
|---|---|---|---|
| Chastine Brandon M | $83,000 | -- | |
| Rogers Real Estate Holdings Lp | -- | -- | |
| Sanchez Jarvis L | $59,900 | -- | |
| Holtzman George W | -- | -- | |
| Webster Wanda | $51,500 | -- |
Source: Public Records
Mortgage History
| Date | Status | Borrower | Loan Amount |
|---|---|---|---|
| Open | Chastine Brandon M | $81,496 |
Source: Public Records
Tax History Compared to Growth
Tax History
| Year | Tax Paid | Tax Assessment Tax Assessment Total Assessment is a certain percentage of the fair market value that is determined by local assessors to be the total taxable value of land and additions on the property. | Land | Improvement |
|---|---|---|---|---|
| 2024 | $1,707 | $46,737 | $3,000 | $43,737 |
| 2023 | $1,707 | $41,632 | $3,000 | $38,632 |
| 2022 | $1,426 | $34,480 | $3,000 | $31,480 |
| 2021 | $1,314 | $31,345 | $3,000 | $28,345 |
| 2020 | $1,341 | $31,686 | $3,000 | $28,686 |
| 2019 | $1,531 | $32,028 | $3,000 | $29,028 |
| 2018 | $1,214 | $29,296 | $3,000 | $26,296 |
| 2017 | $965 | $29,296 | $3,000 | $26,296 |
| 2016 | $1,176 | $29,637 | $3,000 | $26,637 |
| 2015 | $1,254 | $29,637 | $3,000 | $26,637 |
| 2014 | $1,254 | $31,024 | $3,000 | $28,024 |
| 2013 | -- | $32,733 | $3,000 | $29,733 |
Source: Public Records
Map
Nearby Homes
- 912 Pineland Ave Unit 23
- 936 Pineland Ave
- 970 Whippoorwill Way
- 773 Shuman St
- 35+ ACRES Wells Rd
- .46 AC Shuman St
- 0 Elma G Miles Pkwy Unit 324139
- 0 Pipkin Rd
- 796 Peggy Sue St
- .58 AC Elma G Miles Pkwy
- 979B Pineland Ave Unit B
- 979B Pineland Ave
- 679 Mcdowell Rd
- 985 Pineland Ave
- 1.09 AC Elma G Miles Pkwy
- 924 Pineland Ave
- 926 Pineland Ave
- 809 Trawind Ct
- 802 Trawind Ct
- 949 Whippoorwill Way
- 925 Pineland Ave
- 807 Trawind Ct
- 950 Whippoorwill Way
- 927 Pineland Ave
- 800 Trawind Ct
- 927 Pinelane Ave
- 951 Whippoorwill Way
- 743 Hearn Rd
- 912 Pineland Ave
- 929 Pineland Ave
- 805 Trawind Ct
- 953 Whippoorwill Way
- 0 Hearn Rd
- 952 Whippoorwill Way
- 803 Trawind Ct