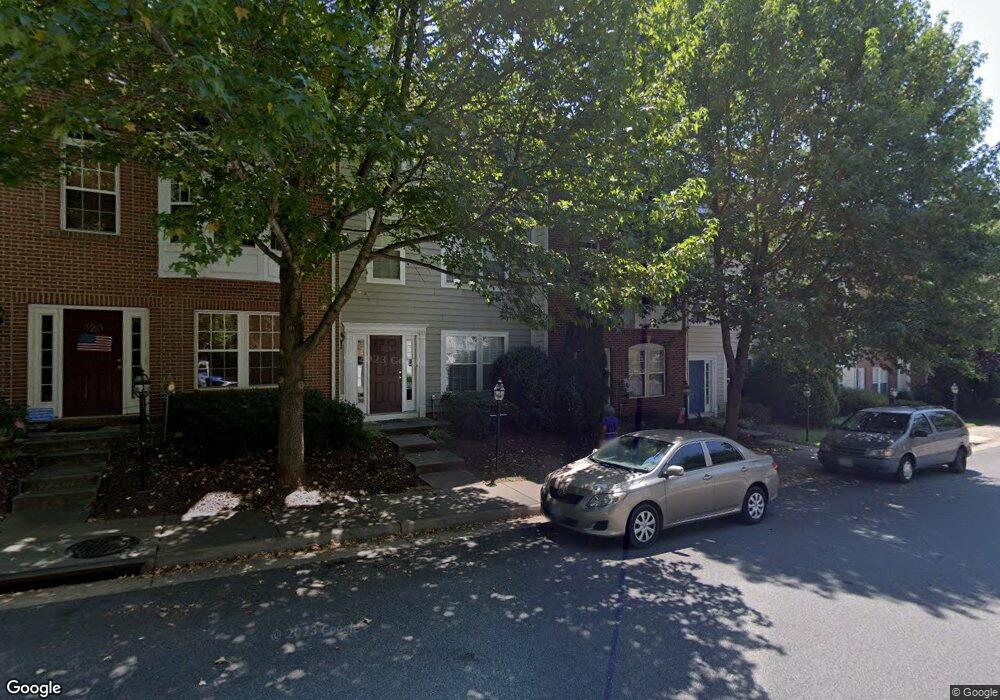
922 Rainier Rd Unit R Charlottesville, VA 22903
Johnson Village NeighborhoodEstimated Value: $511,884 - $551,000
4
Beds
3
Baths
2,520
Sq Ft
$211/Sq Ft
Est. Value
About This Home
This home is located at 922 Rainier Rd Unit R, Charlottesville, VA 22903 and is currently estimated at $532,471, approximately $211 per square foot. 922 Rainier Rd Unit R is a home located in Charlottesville City with nearby schools including Johnson Elementary School, Buford Middle School, and Charlottesville High School.
Ownership History
Date
Name
Owned For
Owner Type
Purchase Details
Closed on
Feb 17, 2020
Sold by
James Temple
Bought by
Vasquez Francis A
Current Estimated Value
Home Financials for this Owner
Home Financials are based on the most recent Mortgage that was taken out on this home.
Original Mortgage
$348,230
Outstanding Balance
$308,333
Interest Rate
3.6%
Mortgage Type
New Conventional
Estimated Equity
$224,138
Purchase Details
Closed on
Jul 17, 2007
Bought by
Temple James
Create a Home Valuation Report for This Property
The Home Valuation Report is an in-depth analysis detailing your home's value as well as a comparison with similar homes in the area
Home Values in the Area
Average Home Value in this Area
Purchase History
| Date | Buyer | Sale Price | Title Company |
|---|---|---|---|
| Vasquez Francis A | $359,000 | Chicago Title Ins Co | |
| Temple James | $335,500 | -- |
Source: Public Records
Mortgage History
| Date | Status | Borrower | Loan Amount |
|---|---|---|---|
| Open | Vasquez Francis A | $348,230 |
Source: Public Records
Tax History
| Year | Tax Paid | Tax Assessment Tax Assessment Total Assessment is a certain percentage of the fair market value that is determined by local assessors to be the total taxable value of land and additions on the property. | Land | Improvement |
|---|---|---|---|---|
| 2025 | $4,740 | $477,800 | $100,000 | $377,800 |
| 2024 | $4,740 | $447,000 | $100,000 | $347,000 |
| 2023 | $4,229 | $434,500 | $87,500 | $347,000 |
| 2022 | $3,950 | $405,500 | $85,000 | $320,500 |
| 2021 | $3,519 | $364,400 | $80,000 | $284,400 |
| 2020 | $3,439 | $355,900 | $80,000 | $275,900 |
| 2019 | $3,203 | $331,100 | $80,000 | $251,100 |
| 2018 | $1,767 | $365,900 | $75,500 | $290,400 |
| 2017 | $3,540 | $366,516 | $75,500 | $291,016 |
| 2016 | $3,451 | $357,200 | $66,200 | $291,000 |
| 2015 | $3,205 | $352,100 | $55,200 | $296,900 |
| 2014 | $3,205 | $333,500 | $48,000 | $285,500 |
Source: Public Records
Map
Nearby Homes
- 1610 Center Ave
- 302 Harris Rd
- 2520 Naylor St
- 202 Raymond Ave
- 202 Raymond Ave Unit 13
- 501 Valley Road Extension
- 103 Longwood Dr Unit E
- 1411 Baker St
- 407 Valley Road Extension Unit A
- 21 Keene Ct
- 35 Keene Ct
- 29 Keene Ct
- 102 N Baker St
- 904 Rock Creek Rd
- 1 Flint Dr
- 22 Keene Ct
- 26 Keene Ct
- 2 Flint Dr
- 28 Keene Ct
- 30 Keene Ct
Your Personal Tour Guide
Ask me questions while you tour the home.