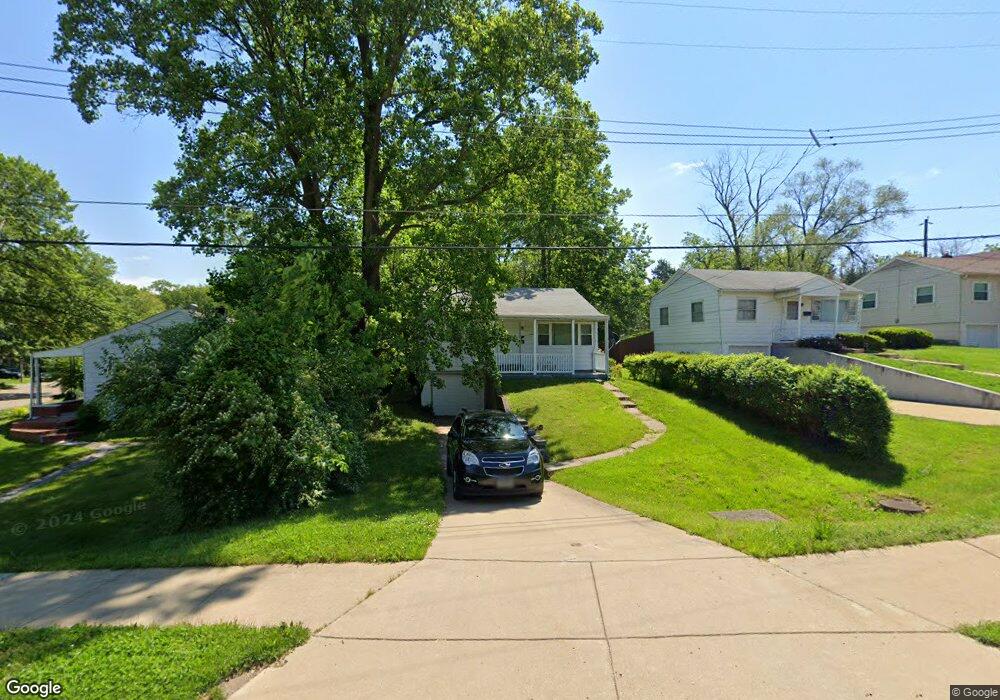
922 S Fillmore Ave Saint Louis, MO 63122
Estimated Value: $122,000 - $219,000
2
Beds
1
Bath
672
Sq Ft
$225/Sq Ft
Est. Value
About This Home
This home is located at 922 S Fillmore Ave, Saint Louis, MO 63122 and is currently estimated at $151,350, approximately $225 per square foot. 922 S Fillmore Ave is a home located in St. Louis County with nearby schools including George R. Robinson Elementary School, Nipher Middle School, and Kirkwood Senior High School.
Ownership History
Date
Name
Owned For
Owner Type
Purchase Details
Closed on
Oct 23, 2024
Sold by
6K Summit Llc
Bought by
Krk Management Llc
Current Estimated Value
Purchase Details
Closed on
Mar 31, 2011
Sold by
Aldan Investments Inc
Bought by
6-K Summit Llc
Purchase Details
Closed on
Feb 24, 2011
Sold by
Anacott Properties Llc
Bought by
Aldan Investments Inc
Purchase Details
Closed on
Aug 24, 1999
Sold by
G Stafford Co Inc
Bought by
Anacott Properties Llc
Home Financials for this Owner
Home Financials are based on the most recent Mortgage that was taken out on this home.
Original Mortgage
$48,000
Interest Rate
8.18%
Purchase Details
Closed on
Aug 3, 1998
Sold by
S & P Properties Inc
Bought by
G Stafford Company
Home Financials for this Owner
Home Financials are based on the most recent Mortgage that was taken out on this home.
Original Mortgage
$40,000
Interest Rate
6.94%
Purchase Details
Closed on
May 6, 1998
Sold by
Cooley Levi A and Cooley Anitha D
Bought by
S & P Properties
Purchase Details
Closed on
Dec 2, 1997
Sold by
Cooley Anitha D
Bought by
Blue Bettie
Create a Home Valuation Report for This Property
The Home Valuation Report is an in-depth analysis detailing your home's value as well as a comparison with similar homes in the area
Home Values in the Area
Average Home Value in this Area
Purchase History
| Date | Buyer | Sale Price | Title Company |
|---|---|---|---|
| Krk Management Llc | $116,000 | None Listed On Document | |
| Krk Management Llc | $116,000 | None Listed On Document | |
| 6-K Summit Llc | $37,000 | Ust | |
| Aldan Investments Inc | $24,000 | None Available | |
| Anacott Properties Llc | -- | -- | |
| G Stafford Company | -- | -- | |
| S & P Properties | $19,556 | -- | |
| Blue Bettie | -- | -- |
Source: Public Records
Mortgage History
| Date | Status | Borrower | Loan Amount |
|---|---|---|---|
| Previous Owner | Anacott Properties Llc | $48,000 | |
| Previous Owner | G Stafford Company | $40,000 |
Source: Public Records
Tax History Compared to Growth
Tax History
| Year | Tax Paid | Tax Assessment Tax Assessment Total Assessment is a certain percentage of the fair market value that is determined by local assessors to be the total taxable value of land and additions on the property. | Land | Improvement |
|---|---|---|---|---|
| 2025 | $1,411 | $25,820 | $15,430 | $10,390 |
| 2024 | $1,411 | $22,170 | $7,980 | $14,190 |
| 2023 | $1,389 | $22,170 | $7,980 | $14,190 |
| 2022 | $1,498 | $20,640 | $8,990 | $11,650 |
| 2021 | $1,356 | $20,640 | $8,990 | $11,650 |
| 2020 | $1,212 | $17,690 | $5,850 | $11,840 |
| 2019 | $1,224 | $17,690 | $5,850 | $11,840 |
| 2018 | $819 | $10,330 | $5,850 | $4,480 |
| 2017 | $818 | $10,330 | $5,850 | $4,480 |
| 2016 | $619 | $7,790 | $3,950 | $3,840 |
| 2015 | $618 | $7,790 | $3,950 | $3,840 |
| 2014 | $800 | $9,970 | $3,340 | $6,630 |
Source: Public Records
Map
Nearby Homes
- 202 Commerce Ave
- 341 New York St
- 709 S Fillmore Ave
- 542 S Fillmore Ave
- 318 Chicago St
- 503 Acorn Dr
- 322 Chicago St
- 532 S Fillmore Ave
- 301 Memphis St
- 343 Memphis St
- 367 Memphis St
- 630 Candleberry Ct Unit D
- 338 Memphis St
- 362 Memphis St
- 322 E Clinton Place
- 219 E Woodbine Ave
- 10835 Big Bend Rd
- 222 Charmers Ct Unit 222
- 1305 Spellman Ave
- 556 Joshua Dr
- 926 S Fillmore Ave
- 918 S Fillmore Ave
- 932 S Fillmore Ave
- 318 Reardon Dr
- 938 S Fillmore Ave
- 322 Reardon Dr
- 908 S Fillmore Ave
- 10447 Big Bend Rd
- 10451 Big Bend Rd
- 10443 Big Bend Rd
- 921 S Fillmore Ave
- 326 Reardon Dr
- 923 S Fillmore Ave
- 927 S Fillmore Ave
- 10439 Big Bend Rd
- 904 S Fillmore Ave
- 931 S Fillmore Ave
- 933 S Fillmore Ave
- 10455 Big Bend Rd
- 939 S Fillmore Ave