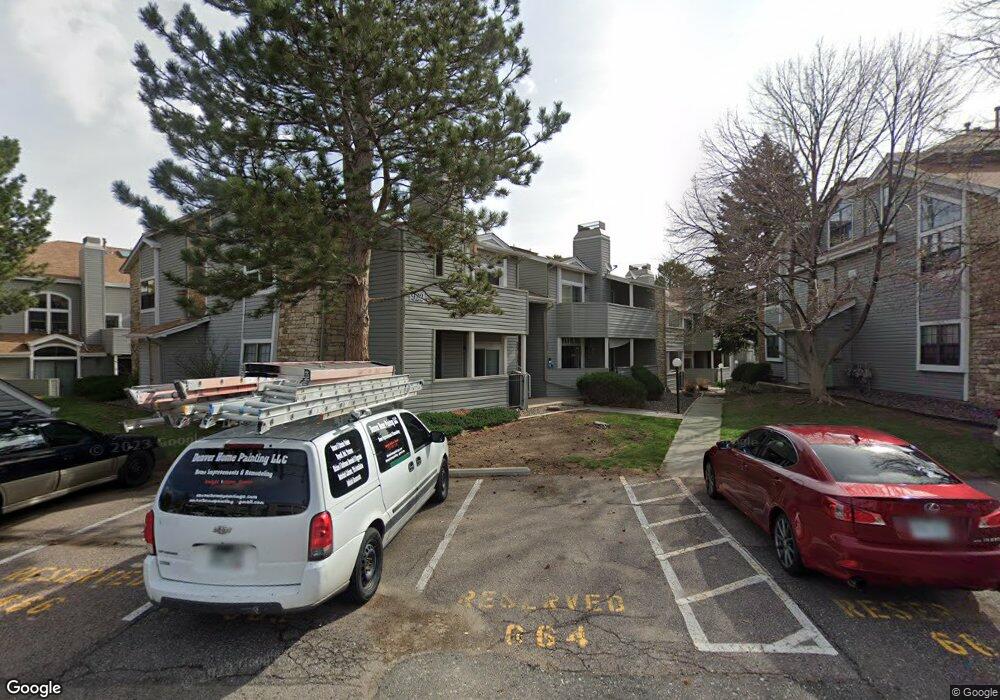
922 S Walden St Unit 203 Aurora, CO 80017
Estimated Value: $187,000 - $192,000
1
Bed
1
Bath
734
Sq Ft
$259/Sq Ft
Est. Value
About This Home
This home is located at 922 S Walden St Unit 203, Aurora, CO 80017 and is currently estimated at $189,948, approximately $258 per square foot. 922 S Walden St Unit 203 is a home located in Arapahoe County with nearby schools including Murphy Creek K-8 School, Vista Peak 9-12 Preparatory, and Vanguard Classical School - East.
Ownership History
Date
Name
Owned For
Owner Type
Purchase Details
Closed on
Aug 2, 2022
Sold by
Kohler Properties Iv Llc
Bought by
Kohler Properties I Llc
Current Estimated Value
Purchase Details
Closed on
Aug 30, 2021
Sold by
Kohler Thomas A
Bought by
Kohler Properties Iv Llc
Purchase Details
Closed on
Dec 24, 1991
Sold by
Kohler Frances M Kohler Thomas A
Bought by
Kohler Thomas A
Purchase Details
Closed on
Nov 17, 1989
Sold by
Sun Savings & Loan Assn
Bought by
Kohler Frances M Kohler Thomas A
Purchase Details
Closed on
Jan 19, 1989
Sold by
Pavco 176 Partnership
Bought by
Sun Savings & Loan Assn
Purchase Details
Closed on
Dec 31, 1987
Sold by
Conversion Arapco
Bought by
Pavco 176 Partnership
Purchase Details
Closed on
Mar 1, 1986
Sold by
Conversion Arapco
Bought by
Conversion Arapco
Purchase Details
Closed on
Jan 30, 1986
Bought by
Conversion Arapco
Create a Home Valuation Report for This Property
The Home Valuation Report is an in-depth analysis detailing your home's value as well as a comparison with similar homes in the area
Home Values in the Area
Average Home Value in this Area
Purchase History
| Date | Buyer | Sale Price | Title Company |
|---|---|---|---|
| Kohler Properties I Llc | -- | None Listed On Document | |
| Kohler Properties Iv Llc | -- | None Available | |
| Kohler Thomas A | -- | -- | |
| Kohler Frances M Kohler Thomas A | -- | -- | |
| Sun Savings & Loan Assn | -- | -- | |
| Pavco 176 Partnership | -- | -- | |
| Conversion Arapco | -- | -- | |
| Conversion Arapco | -- | -- |
Source: Public Records
Tax History Compared to Growth
Tax History
| Year | Tax Paid | Tax Assessment Tax Assessment Total Assessment is a certain percentage of the fair market value that is determined by local assessors to be the total taxable value of land and additions on the property. | Land | Improvement |
|---|---|---|---|---|
| 2024 | $970 | $10,439 | -- | -- |
| 2023 | $970 | $10,439 | $0 | $0 |
| 2022 | $1,105 | $11,002 | $0 | $0 |
| 2021 | $1,140 | $11,002 | $0 | $0 |
| 2020 | $1,098 | $10,546 | $0 | $0 |
| 2019 | $1,092 | $10,546 | $0 | $0 |
| 2018 | $835 | $7,898 | $0 | $0 |
| 2017 | $726 | $7,898 | $0 | $0 |
| 2016 | $436 | $4,641 | $0 | $0 |
| 2015 | $421 | $4,641 | $0 | $0 |
| 2014 | $251 | $2,667 | $0 | $0 |
| 2013 | -- | $3,320 | $0 | $0 |
Source: Public Records
Map
Nearby Homes
- 921 S Walden St Unit 108
- 922 S Walden St Unit 201
- 18391 E Kepner Place Unit 103
- 908 S Walden Way Unit 201
- 906 S Walden St Unit 104
- 18494 E Kepner Place Unit 204
- 904 S Walden Way Unit 204
- 931 S Zeno Way Unit 107
- 907 S Yampa St Unit 205
- 983 S Zeno Way
- 1006 S Waco Way
- 18105 E Ohio Ave Unit 204
- 1030 S Zeno Way
- 18073 E Ohio Ave Unit 203
- 18034 E Ohio Ave Unit 104
- 1026 S Waco Way
- 18063 E Ohio Ave Unit 201
- 18043 E Ohio Ave Unit 202
- 18004 E Ohio Ave Unit 101
- 18033 E Ohio Ave Unit 201
- 922 S Walden St Unit 208
- 922 S Walden St Unit 207
- 922 S Walden St Unit 206
- 922 S Walden St Unit 204
- 922 S Walden St Unit 202
- 922 S Walden St Unit 108
- 922 S Walden St Unit 107
- 922 S Walden St Unit 106
- 922 S Walden St Unit 105
- 922 S Walden St Unit 104
- 922 S Walden St Unit 103
- 922 S Walden St Unit 102
- 922 S Walden St Unit 10103
- 921 S Walden St Unit 208
- 921 S Walden St Unit 207
- 921 S Walden St Unit 206
- 921 S Walden St Unit 204
- 921 S Walden St Unit 203
- 921 S Walden St Unit 202
- 921 S Walden St Unit 201