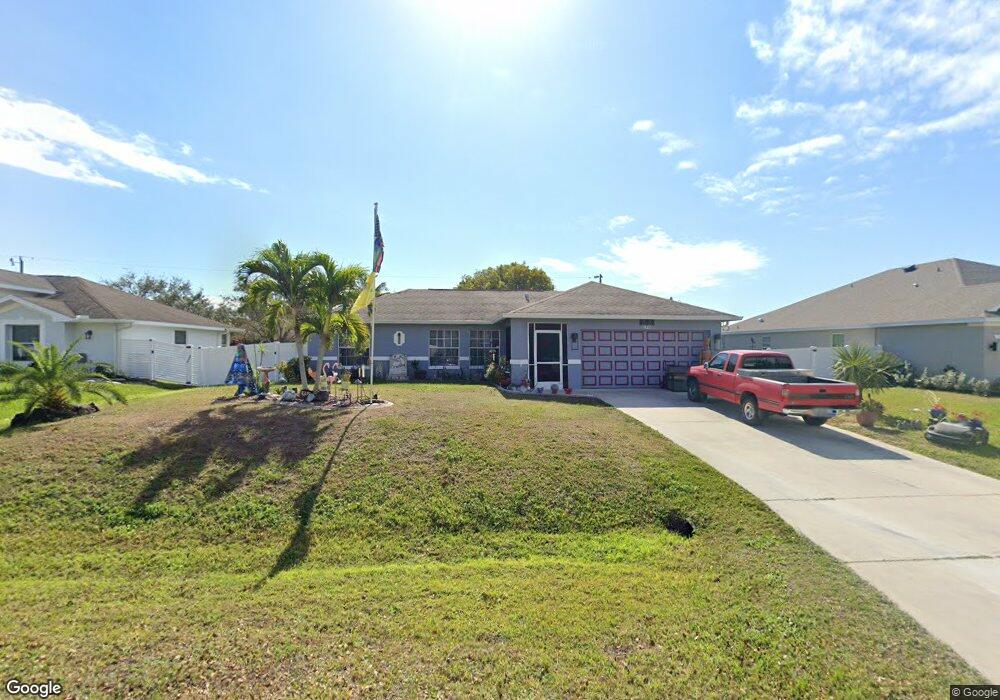
922 SW 29th St Cape Coral, FL 33914
Pelican NeighborhoodEstimated Value: $275,263 - $318,000
3
Beds
2
Baths
1,505
Sq Ft
$198/Sq Ft
Est. Value
About This Home
This home is located at 922 SW 29th St, Cape Coral, FL 33914 and is currently estimated at $297,316, approximately $197 per square foot. 922 SW 29th St is a home located in Lee County with nearby schools including Cape Elementary School, Caloosa Elementary School, and Tropic Isles Elementary School.
Ownership History
Date
Name
Owned For
Owner Type
Purchase Details
Closed on
May 24, 2013
Sold by
Barbour Real Estate Llc
Bought by
Dentzau William and Dentzau Pamela
Current Estimated Value
Home Financials for this Owner
Home Financials are based on the most recent Mortgage that was taken out on this home.
Original Mortgage
$101,700
Outstanding Balance
$47,385
Interest Rate
3.44%
Mortgage Type
Future Advance Clause Open End Mortgage
Estimated Equity
$249,931
Purchase Details
Closed on
Dec 21, 2012
Sold by
Krabill Gregory W
Bought by
Barbour Real Estate Llc
Purchase Details
Closed on
Oct 24, 2006
Sold by
Krabill Gregory W and Krabill Nancy
Bought by
Krabill Gregory W and Krabill Nancy
Home Financials for this Owner
Home Financials are based on the most recent Mortgage that was taken out on this home.
Original Mortgage
$160,000
Interest Rate
9.75%
Mortgage Type
New Conventional
Create a Home Valuation Report for This Property
The Home Valuation Report is an in-depth analysis detailing your home's value as well as a comparison with similar homes in the area
Home Values in the Area
Average Home Value in this Area
Purchase History
| Date | Buyer | Sale Price | Title Company |
|---|---|---|---|
| Dentzau William | $113,000 | Morgan & Associates Title Co | |
| Barbour Real Estate Llc | $68,200 | None Available | |
| Krabill Gregory W | $54,500 | Boston National Title Llc |
Source: Public Records
Mortgage History
| Date | Status | Borrower | Loan Amount |
|---|---|---|---|
| Open | Dentzau William | $101,700 | |
| Previous Owner | Krabill Gregory W | $160,000 |
Source: Public Records
Tax History Compared to Growth
Tax History
| Year | Tax Paid | Tax Assessment Tax Assessment Total Assessment is a certain percentage of the fair market value that is determined by local assessors to be the total taxable value of land and additions on the property. | Land | Improvement |
|---|---|---|---|---|
| 2025 | $3,068 | $95,979 | -- | -- |
| 2024 | $2,984 | $93,274 | -- | -- |
| 2023 | $2,984 | $90,557 | $0 | $0 |
| 2022 | $2,839 | $87,919 | $0 | $0 |
| 2021 | $2,800 | $158,763 | $29,659 | $129,104 |
| 2020 | $2,731 | $84,179 | $0 | $0 |
| 2019 | $2,662 | $82,286 | $0 | $0 |
| 2018 | $2,637 | $80,752 | $0 | $0 |
| 2017 | $2,620 | $79,091 | $0 | $0 |
| 2016 | $2,655 | $115,151 | $17,771 | $97,380 |
| 2015 | $2,632 | $104,099 | $12,842 | $91,257 |
| 2014 | -- | $96,996 | $6,600 | $90,396 |
| 2013 | -- | $81,798 | $4,200 | $77,598 |
Source: Public Records
Map
Nearby Homes
- 835 SW 28th Terrace
- 930 SW 28th St
- 2933 SW 11th Place
- 2718 SW 9th Place
- 2814 SW 8th Place
- 2733 SW 11th Ave
- 820 SW 28th St
- 2828 Skyline Blvd
- 926 SW 28th St
- 836 SW 28th St
- 1132 SW 29th St
- 2720 SW 11th Ave
- 4123 Skyline Blvd
- 2913 Skyline Blvd
- 2628 SW 10th Ave
- 3025 SW 8th Place
- 3042 SW 10th Place
- 2712 SW 8th Place
- 2818 SW 7th Place
- 2942/2944 SW 7th Place
- 918 SW 29th St
- 923 SW 29th Terrace
- 919 SW 29th Terrace Unit 66
- 927 SW 29th Terrace
- 914 SW 29th St
- 925 SW 29th St
- 921 SW 29th St
- 915 SW 29th Terrace
- 917 SW 29th St
- 929 SW 29th St
- 910 SW 29th St
- 2912 SW 10th Ave
- 911 SW 29th Terrace
- 913 SW 29th St
- 2920 SW 10th Ave
- 924 SW 28th Terrace
- 2928 SW 9th Place
- 920 SW 28th Terrace
- 2929 SW 10th Ave