Estimated Value: $409,218 - $481,000
Studio
--
Bath
1,676
Sq Ft
$268/Sq Ft
Est. Value
About This Home
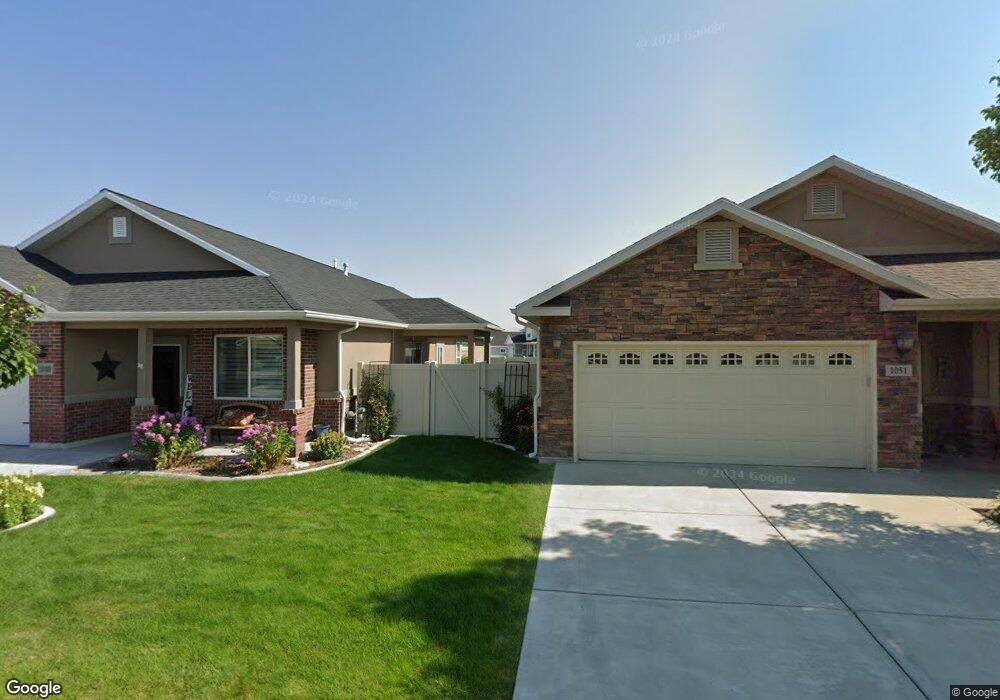
This home is located at 922 W 2730 S, Logan, UT 84321 and is currently estimated at $448,805, approximately $267 per square foot. 922 W 2730 S is a home with nearby schools including Nibley School, Spring Creek Middle School, and South Cache Middle School.
Ownership History
Date
Name
Owned For
Owner Type
Purchase Details
Closed on
Jan 11, 2016
Sold by
Olsen Elaine T and Olsen Elaine Tripp
Bought by
Olsen Elaine T
Current Estimated Value
Home Financials for this Owner
Home Financials are based on the most recent Mortgage that was taken out on this home.
Original Mortgage
$131,000
Outstanding Balance
$103,702
Interest Rate
3.9%
Mortgage Type
New Conventional
Estimated Equity
$345,103
Purchase Details
Closed on
Feb 18, 2015
Sold by
Olsen Elaine Tripp and Olsen John Erik
Bought by
Olsen Elaine Tripp
Purchase Details
Closed on
Apr 12, 2005
Sold by
Neighborhood Nonprofit Housing Corporati
Bought by
Olsen John E and Olsen Elaine T
Home Financials for this Owner
Home Financials are based on the most recent Mortgage that was taken out on this home.
Original Mortgage
$123,166
Interest Rate
5.77%
Mortgage Type
USDA
Create a Home Valuation Report for This Property
The Home Valuation Report is an in-depth analysis detailing your home's value as well as a comparison with similar homes in the area
Home Values in the Area
Average Home Value in this Area
Purchase History
| Date | Buyer | Sale Price | Title Company |
|---|---|---|---|
| Olsen Elaine T | -- | Hickman Land Title Company | |
| Olsen Elaine T | -- | Hickman Land Title Company | |
| Olsen Elaine Tripp | $20,000 | None Available | |
| Olsen John E | -- | Cache Title Company |
Source: Public Records
Mortgage History
| Date | Status | Borrower | Loan Amount |
|---|---|---|---|
| Open | Olsen Elaine T | $131,000 | |
| Closed | Olsen John E | $123,166 |
Source: Public Records
Tax History
| Year | Tax Paid | Tax Assessment Tax Assessment Total Assessment is a certain percentage of the fair market value that is determined by local assessors to be the total taxable value of land and additions on the property. | Land | Improvement |
|---|---|---|---|---|
| 2025 | $1,580 | $209,500 | $0 | $0 |
| 2024 | $1,688 | $210,075 | $0 | $0 |
| 2023 | $1,763 | $205,480 | $0 | $0 |
| 2022 | $1,835 | $205,480 | $0 | $0 |
| 2021 | $1,736 | $301,880 | $65,000 | $236,880 |
| 2020 | $1,443 | $238,938 | $65,000 | $173,938 |
| 2019 | $1,514 | $238,937 | $65,000 | $173,937 |
| 2018 | $1,281 | $197,250 | $46,000 | $151,250 |
| 2017 | $1,237 | $100,925 | $0 | $0 |
| 2016 | $1,251 | $100,925 | $0 | $0 |
| 2015 | $1,101 | $89,360 | $0 | $0 |
| 2014 | $1,076 | $89,360 | $0 | $0 |
| 2013 | -- | $89,405 | $0 | $0 |
Source: Public Records
Map
Nearby Homes
- 939 Nibley Pkwy
- 2770 S 1070 West Sunset Park
- 2814 S 1100 W
- 2882 S 1080 W
- 732 W 2840 S Unit 7
- 712 W 2840 S Unit 9
- 702 W 2840 S Unit 10
- 722 W 2840 S Unit 8
- 860 W 2980 S
- 2680 S 600 W
- 2463 S 660 W
- 1045 W 2400 S
- 2938 S 600 W
- 2313 S 1000 W Unit 110
- 2313 S 1000 W
- 1325 N 1250 E Unit 39
- 1336 N 1250 St E Unit 44
- 1250 W 2420 S
- 1050 W 3200 S
- 1254 W 2401 S
Your Personal Tour Guide
Ask me questions while you tour the home.