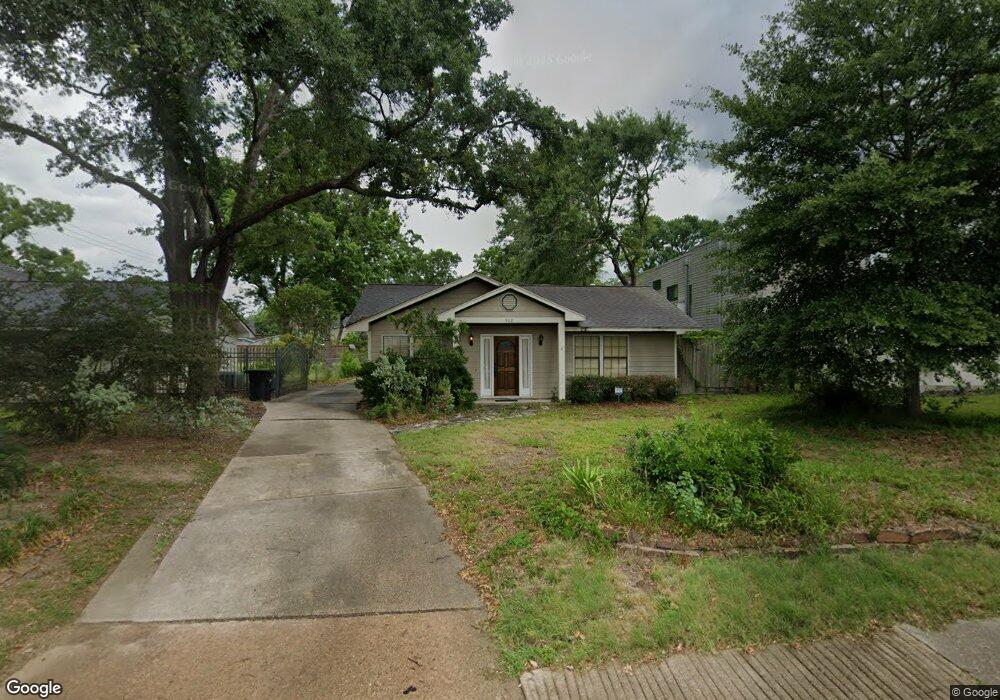
922 W 43rd St Houston, TX 77018
Oak Forest-Garden Oaks NeighborhoodEstimated Value: $596,311 - $838,000
3
Beds
2
Baths
1,530
Sq Ft
$432/Sq Ft
Est. Value
About This Home
This home is located at 922 W 43rd St, Houston, TX 77018 and is currently estimated at $661,328, approximately $432 per square foot. 922 W 43rd St is a home located in Harris County with nearby schools including Durham Elementary School, Frank Black Middle School, and Waltrip High School.
Ownership History
Date
Name
Owned For
Owner Type
Purchase Details
Closed on
Apr 24, 2025
Sold by
Price Thomas Marston
Bought by
Price Thomas Marston and Thomas Marston Price Revocable Trust
Current Estimated Value
Purchase Details
Closed on
Jul 19, 2005
Sold by
Bohn William B and Bohn Susan M Kolar
Bought by
Price Thomas
Home Financials for this Owner
Home Financials are based on the most recent Mortgage that was taken out on this home.
Original Mortgage
$183,200
Interest Rate
5.58%
Mortgage Type
Fannie Mae Freddie Mac
Purchase Details
Closed on
Apr 30, 2003
Sold by
Roller Scott D and Roller Amy J
Bought by
Bohn William B and Bohn Susan M Kolar
Home Financials for this Owner
Home Financials are based on the most recent Mortgage that was taken out on this home.
Original Mortgage
$164,000
Interest Rate
5.87%
Purchase Details
Closed on
Sep 21, 1998
Sold by
Garman James and Garman Susan
Bought by
Roller Scott D and Roller Amy J
Home Financials for this Owner
Home Financials are based on the most recent Mortgage that was taken out on this home.
Original Mortgage
$138,950
Interest Rate
6.91%
Create a Home Valuation Report for This Property
The Home Valuation Report is an in-depth analysis detailing your home's value as well as a comparison with similar homes in the area
Home Values in the Area
Average Home Value in this Area
Purchase History
| Date | Buyer | Sale Price | Title Company |
|---|---|---|---|
| Price Thomas Marston | -- | None Listed On Document | |
| Price Thomas | -- | Houston Title Co | |
| Bohn William B | -- | Chicago Title | |
| Roller Scott D | -- | American Title Company |
Source: Public Records
Mortgage History
| Date | Status | Borrower | Loan Amount |
|---|---|---|---|
| Previous Owner | Price Thomas | $183,200 | |
| Previous Owner | Bohn William B | $164,000 | |
| Previous Owner | Roller Scott D | $138,950 | |
| Closed | Bohn William B | $30,700 |
Source: Public Records
Tax History Compared to Growth
Tax History
| Year | Tax Paid | Tax Assessment Tax Assessment Total Assessment is a certain percentage of the fair market value that is determined by local assessors to be the total taxable value of land and additions on the property. | Land | Improvement |
|---|---|---|---|---|
| 2025 | $8,538 | $579,962 | $461,093 | $118,869 |
| 2024 | $8,538 | $560,961 | $422,668 | $138,293 |
| 2023 | $8,538 | $526,072 | $399,614 | $126,458 |
| 2022 | $10,713 | $493,577 | $399,614 | $93,963 |
| 2021 | $10,309 | $442,327 | $368,874 | $73,453 |
| 2020 | $9,755 | $402,831 | $322,765 | $80,066 |
| 2019 | $10,916 | $431,369 | $322,765 | $108,604 |
| 2018 | $7,680 | $392,318 | $387,318 | $5,000 |
| 2017 | $9,920 | $392,318 | $387,318 | $5,000 |
| 2016 | $10,861 | $472,057 | $387,318 | $84,739 |
| 2015 | $7,159 | $433,024 | $322,765 | $110,259 |
| 2014 | $7,159 | $382,231 | $276,656 | $105,575 |
Source: Public Records
Map
Nearby Homes
- 934 W 43rd St
- 903 W 43rd St
- 938 Gardenia Dr
- 979 W 43rd St
- 830 Azalea St
- 991 Curtin St
- 814 Azalea St
- 1067 Curtin St
- 1018 Lamonte Ln
- 1014 Gardenia Dr
- 959 Althea Dr
- 1020 W 42nd St
- 1547 Sue Barnett Dr
- 4510 Curtin Park Ct
- 1550 Sue Barnett Dr
- 1046 Gardenia Dr
- 739 Azaleadell Dr
- 963 W 41st St
- 834 W 41st St
- 1062 Lamonte Ln