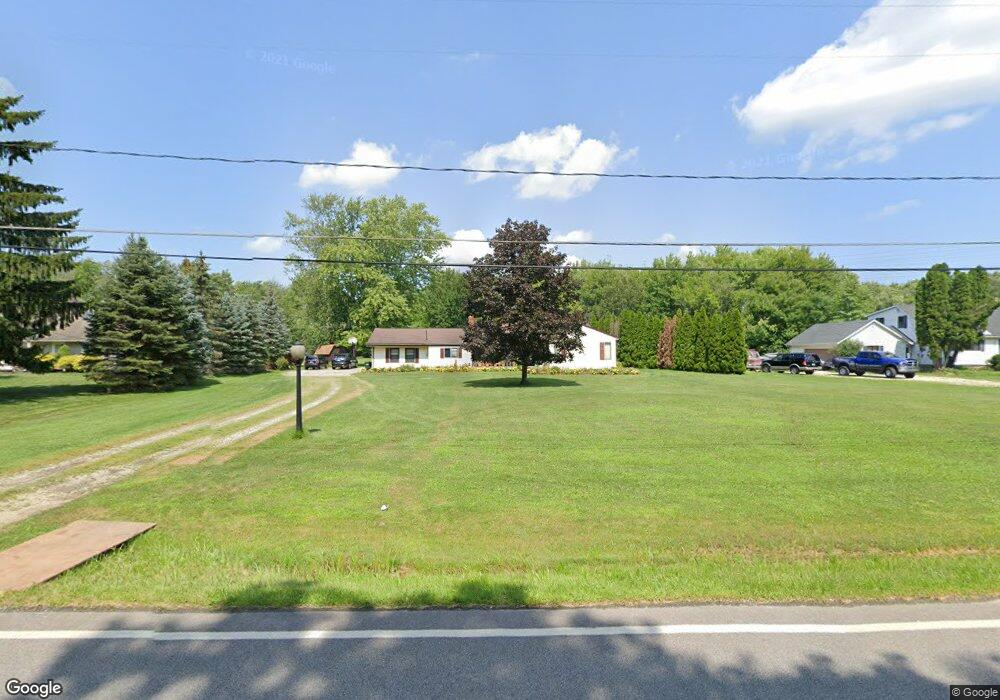
9220 Lindbergh Blvd Olmsted Falls, OH 44138
Estimated Value: $292,776 - $315,000
4
Beds
1
Bath
1,862
Sq Ft
$165/Sq Ft
Est. Value
About This Home
This home is located at 9220 Lindbergh Blvd, Olmsted Falls, OH 44138 and is currently estimated at $306,694, approximately $164 per square foot. 9220 Lindbergh Blvd is a home located in Cuyahoga County with nearby schools including Falls-Lenox Primary Elementary School, Olmsted Falls Intermediate Building, and Olmsted Falls Middle School.
Ownership History
Date
Name
Owned For
Owner Type
Purchase Details
Closed on
Jul 12, 2005
Sold by
Frederick David O and Frederick Patricia E
Bought by
Frederick David O and Frederick Patricia E
Current Estimated Value
Purchase Details
Closed on
May 26, 1995
Sold by
Evans Mark A
Bought by
Kovach Steve E and Kovach Janet M
Home Financials for this Owner
Home Financials are based on the most recent Mortgage that was taken out on this home.
Original Mortgage
$63,000
Interest Rate
8.4%
Mortgage Type
New Conventional
Purchase Details
Closed on
Jul 21, 1983
Sold by
Knable Coletta Ruth
Bought by
Evans Mark A
Purchase Details
Closed on
Nov 22, 1978
Sold by
Knable Robert L and Knable Coletta R
Bought by
Knable Coletta Ruth
Purchase Details
Closed on
Jan 1, 1975
Bought by
Knable Robert L and Knable Coletta R
Create a Home Valuation Report for This Property
The Home Valuation Report is an in-depth analysis detailing your home's value as well as a comparison with similar homes in the area
Home Values in the Area
Average Home Value in this Area
Purchase History
| Date | Buyer | Sale Price | Title Company |
|---|---|---|---|
| Frederick David O | -- | Chicago Title Insurance C | |
| Kovach Steve E | $153,000 | -- | |
| Evans Mark A | $53,000 | -- | |
| Knable Coletta Ruth | -- | -- | |
| Knable Robert L | -- | -- |
Source: Public Records
Mortgage History
| Date | Status | Borrower | Loan Amount |
|---|---|---|---|
| Closed | Kovach Steve E | $63,000 |
Source: Public Records
Tax History Compared to Growth
Tax History
| Year | Tax Paid | Tax Assessment Tax Assessment Total Assessment is a certain percentage of the fair market value that is determined by local assessors to be the total taxable value of land and additions on the property. | Land | Improvement |
|---|---|---|---|---|
| 2024 | $5,687 | $84,735 | $13,790 | $70,945 |
| 2023 | $5,472 | $67,940 | $19,430 | $48,510 |
| 2022 | $5,496 | $67,940 | $19,430 | $48,510 |
| 2021 | $5,449 | $67,940 | $19,430 | $48,510 |
| 2020 | $5,299 | $59,610 | $17,050 | $42,560 |
| 2019 | $5,442 | $170,300 | $48,700 | $121,600 |
| 2018 | $5,688 | $59,610 | $17,050 | $42,560 |
| 2017 | $5,900 | $60,800 | $19,460 | $41,340 |
| 2016 | $5,875 | $60,800 | $19,460 | $41,340 |
| 2015 | $5,999 | $60,800 | $19,460 | $41,340 |
| 2014 | $5,999 | $60,800 | $19,460 | $41,340 |
Source: Public Records
Map
Nearby Homes
- 732 Wyleswood Dr
- 8873 Ashlyn Ct Unit 13A
- 8757 Roberts Ct Unit 25C
- 540 Crossbrook Dr
- 25331 Tyndall Falls Dr
- 396 Crossbrook Dr
- Passionflower II Plan at Aspire at Longbrooke
- Daffodil II Plan at Aspire at Longbrooke
- 549 Wyleswood Dr
- 543 Wyleswood Dr
- 537 Wyleswood Dr
- 9675 E Northwood Dr
- 517 Wyleswood Dr
- 9672 E Northwood Dr
- Bramante Ranch w/ Finished Basement Plan at Smokestack Trails
- Columbia w/ Finished Basement Plan at Smokestack Trails
- Hudson w/ Finished Basement Plan at Smokestack Trails
- Anderson w/ Finished Basement Plan at Smokestack Trails
- Lehigh w/ Finished Basement Plan at Smokestack Trails
- 9757 Wainwright Terrace
- 9200 Lindbergh Blvd
- 9240 Lindbergh Blvd
- 9180 Lindbergh Blvd
- 9250 Lindbergh Blvd
- 9225 Lindbergh Blvd
- 9256 Lindbergh Blvd
- SL 2 Lindbergh Blvd
- SL 3 Lindbergh Blvd
- SL 1 Lindbergh Blvd
- 0 Lindbergh Blvd
- 9199 Lindbergh Blvd
- 9265 Lindbergh Blvd
- 9255 Lindbergh Blvd
- 9269 Lindbergh Blvd
- 9271 Lindbergh Blvd
- 9112 Lindbergh Blvd
- 9119 Lindbergh Blvd
- 9139 Lindbergh Blvd
- 9277 Lindbergh Blvd
- V/L Lindbergh Blvd