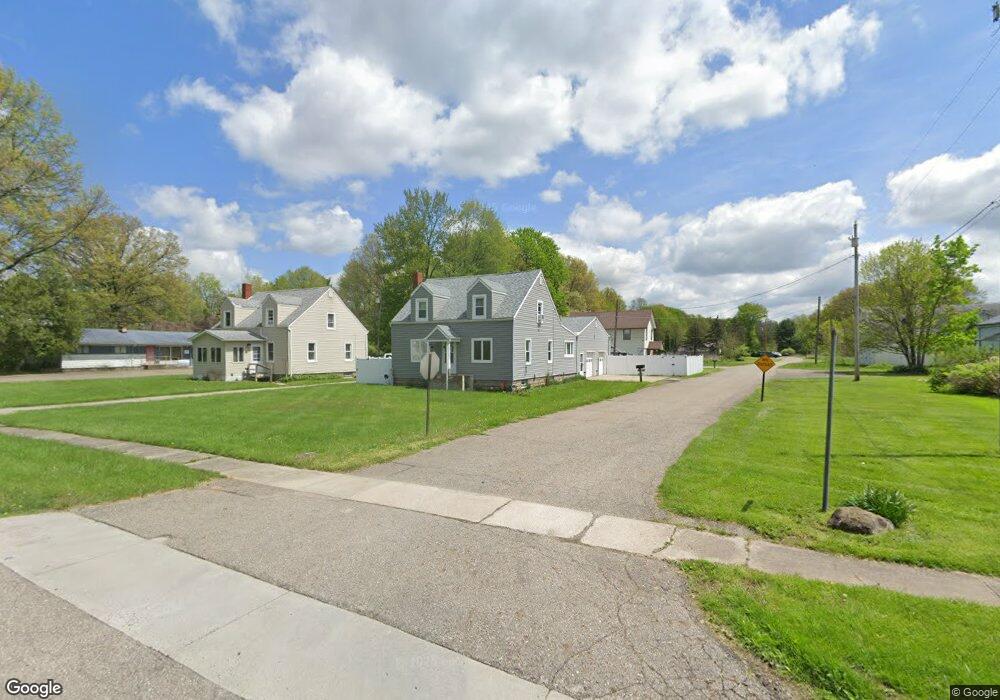
9220 N Main St Windham, OH 44288
Estimated Value: $156,846 - $179,000
3
Beds
2
Baths
1,470
Sq Ft
$113/Sq Ft
Est. Value
About This Home
This home is located at 9220 N Main St, Windham, OH 44288 and is currently estimated at $165,962, approximately $112 per square foot. 9220 N Main St is a home located in Portage County with nearby schools including Katherine Thomas Elementary School, Windham Junior High School, and Windham High School.
Ownership History
Date
Name
Owned For
Owner Type
Purchase Details
Closed on
Dec 30, 2019
Sold by
Tushar Theresa
Bought by
Tushar Theresa B and Tushar Brittany N
Current Estimated Value
Purchase Details
Closed on
Aug 9, 2017
Sold by
Mcdivitt Matilda
Bought by
Theresa Tushar
Purchase Details
Closed on
Apr 5, 2016
Sold by
Mcdivitt Matilda and Matilda Mcdivitt Revocable Tru
Bought by
Mcdivitt Matilda
Purchase Details
Closed on
Oct 11, 2010
Sold by
Mcdivitt Matilda K
Bought by
Mcdivitt Matilda and Matilda Mcdivitt Revocable Tru
Purchase Details
Closed on
Feb 28, 2007
Sold by
Kelley Judith
Bought by
Mcdivitt Matilda K
Purchase Details
Closed on
Dec 5, 2005
Sold by
Estate Of Joyce E Heckman
Bought by
Kelley Judith
Purchase Details
Closed on
May 8, 2002
Sold by
Mcdivitt Matilda
Bought by
Heckman Joyce
Purchase Details
Closed on
May 1, 1992
Bought by
Mcdivitt Matilda
Create a Home Valuation Report for This Property
The Home Valuation Report is an in-depth analysis detailing your home's value as well as a comparison with similar homes in the area
Purchase History
| Date | Buyer | Sale Price | Title Company |
|---|---|---|---|
| Tushar Theresa B | -- | None Available | |
| Theresa Tushar | -- | -- | |
| Mcdivitt Matilda | -- | None Available | |
| Mcdivitt Matilda | -- | Attorney | |
| Mcdivitt Matilda K | -- | Attorney | |
| Kelley Judith | -- | None Available | |
| Heckman Joyce | -- | -- | |
| Mcdivitt Matilda | -- | -- |
Source: Public Records
Tax History
| Year | Tax Paid | Tax Assessment Tax Assessment Total Assessment is a certain percentage of the fair market value that is determined by local assessors to be the total taxable value of land and additions on the property. | Land | Improvement |
|---|---|---|---|---|
| 2025 | $2,139 | $49,850 | $4,450 | $45,400 |
| 2024 | $2,093 | $49,850 | $4,450 | $45,400 |
| 2023 | $1,332 | $28,180 | $3,540 | $24,640 |
| 2022 | $1,306 | $28,180 | $3,540 | $24,640 |
| 2021 | $1,290 | $28,180 | $3,540 | $24,640 |
| 2020 | $1,018 | $20,860 | $2,730 | $18,130 |
| 2019 | $1,167 | $20,860 | $2,730 | $18,130 |
| 2018 | $1,036 | $21,210 | $3,360 | $17,850 |
| 2017 | $615 | $21,210 | $3,360 | $17,850 |
| 2016 | $610 | $21,210 | $3,360 | $17,850 |
| 2015 | $610 | $21,210 | $3,360 | $17,850 |
| 2014 | $658 | $22,160 | $3,360 | $18,800 |
| 2013 | $651 | $22,160 | $3,360 | $18,800 |
Source: Public Records
Map
Nearby Homes
- 9564 Wolfe Rd
- 8935 S Main St
- 9008 Wilverne Dr
- 9841 Green Dr
- 9852 Belden Dr
- 8974 Wil Verne Dr
- 9870 Short Dr
- 0 Bryant & Sr 82
- 0 Bryant Rd
- 9700 Silica Sand Rd
- 10168 Stanley Rd
- 924 N Jewell Rd
- 8698 Pierce Rd
- 7795 Ohio 303
- 10154 Ohio 88
- 8405 Eagle Creek Dr
- 10650 Liberty St
- 8093 South Park
- 9310 Slagle Rd
- 8176 Windham St
- 9210 N Main St
- 9217 N Main St
- 9235 N Main St
- 0 Main Unit 3256503
- 0 Main Unit 4495002
- 9270 N Main St
- 9215 N Main St
- 9257 N Main St
- 9269 N Main St
- 9525 Park Ave
- 9450 Edgewood Dr
- 9276 N Main St
- 9283 N Main St
- 9440 Edgewood Dr
- 9175 N Main St
- 9430 Edgewood Dr
- 9297 N Main St
- 9441 Edgewood Dr
- 9420 Edgewood Dr
- 9154 Maple Grove Rd
Your Personal Tour Guide
Ask me questions while you tour the home.