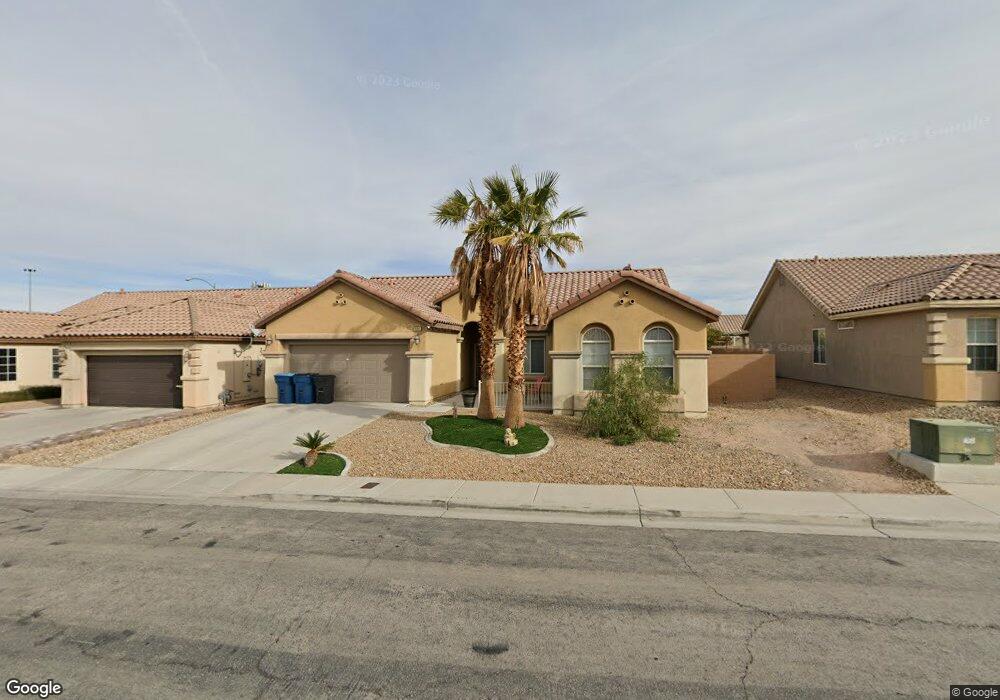
9220 Onyx Point Ct Henderson, NV 89074
Green Valley South NeighborhoodEstimated Value: $551,188 - $575,000
3
Beds
2
Baths
1,925
Sq Ft
$293/Sq Ft
Est. Value
About This Home
This home is located at 9220 Onyx Point Ct, Henderson, NV 89074 and is currently estimated at $563,297, approximately $292 per square foot. 9220 Onyx Point Ct is a home located in Clark County with nearby schools including John Vanderburg Elementary School, Neil C. Twitchell Elementary School, and Bob Miller Middle School.
Ownership History
Date
Name
Owned For
Owner Type
Purchase Details
Closed on
Jan 23, 2018
Sold by
Oneil James
Bought by
Oneil Lynn
Current Estimated Value
Purchase Details
Closed on
Feb 16, 2015
Sold by
Sobaszek Lynn
Bought by
Sobaszek Lynn and Neil James T O
Purchase Details
Closed on
Oct 31, 2013
Sold by
Sobaszek Lynn and Sobaszek Gerald F
Bought by
Sobaszek Lynn
Purchase Details
Closed on
Jul 28, 2011
Sold by
Taylor Jacy
Bought by
Sobaszek Lynn M and Sobaszek Gerald F
Home Financials for this Owner
Home Financials are based on the most recent Mortgage that was taken out on this home.
Original Mortgage
$161,196
Outstanding Balance
$13,182
Interest Rate
4.4%
Mortgage Type
FHA
Estimated Equity
$550,115
Purchase Details
Closed on
Jan 24, 2005
Sold by
Richmond American Homes Of Nevada Inc
Bought by
Taylor Jacy
Home Financials for this Owner
Home Financials are based on the most recent Mortgage that was taken out on this home.
Original Mortgage
$333,664
Interest Rate
6%
Mortgage Type
New Conventional
Create a Home Valuation Report for This Property
The Home Valuation Report is an in-depth analysis detailing your home's value as well as a comparison with similar homes in the area
Home Values in the Area
Average Home Value in this Area
Purchase History
| Date | Buyer | Sale Price | Title Company |
|---|---|---|---|
| Oneil Lynn | -- | None Available | |
| Sobaszek Lynn | -- | None Available | |
| Sobaszek Lynn | $210,000 | None Available | |
| Sobaszek Lynn M | $168,000 | Nevada Title Las Vegas | |
| Taylor Jacy | $417,080 | First Amer Title Co Of Nv |
Source: Public Records
Mortgage History
| Date | Status | Borrower | Loan Amount |
|---|---|---|---|
| Open | Sobaszek Lynn M | $161,196 | |
| Previous Owner | Taylor Jacy | $333,664 | |
| Closed | Taylor Jacy | $83,416 |
Source: Public Records
Tax History Compared to Growth
Tax History
| Year | Tax Paid | Tax Assessment Tax Assessment Total Assessment is a certain percentage of the fair market value that is determined by local assessors to be the total taxable value of land and additions on the property. | Land | Improvement |
|---|---|---|---|---|
| 2025 | $2,863 | $165,354 | $56,000 | $109,354 |
| 2024 | $2,781 | $165,354 | $56,000 | $109,354 |
| 2023 | $2,781 | $154,237 | $51,800 | $102,437 |
| 2022 | $2,700 | $119,558 | $40,250 | $79,308 |
| 2021 | $2,203 | $115,413 | $40,250 | $75,163 |
| 2020 | $2,136 | $100,395 | $25,900 | $74,495 |
| 2019 | $2,074 | $95,909 | $22,750 | $73,159 |
| 2018 | $2,013 | $89,569 | $19,250 | $70,319 |
| 2017 | $2,621 | $89,375 | $18,200 | $71,175 |
| 2016 | $1,907 | $82,400 | $18,200 | $64,200 |
| 2015 | $1,903 | $62,814 | $12,950 | $49,864 |
| 2014 | $1,843 | $61,929 | $10,150 | $51,779 |
Source: Public Records
Map
Nearby Homes
- 9024 Trombone Ln
- 2827 Richmar Ave
- 2916 Candelaria Dr
- 0 Richmar Ave
- 0 Delano Dr
- 3020 Delano Dr
- 2839 Edgemont Dr
- 8953 Belconte Ln
- 2494 Via di Autostrada
- 21 Megan Dr Unit 3
- 2802 Camelback Ln
- 36 Tidwell Ln
- 2903 Hardin Dr
- 2476 Via de Milano
- 43 Fantasia Ln
- 2439 Avenida Flores
- 2427 Worchester Rd
- 27 Bishopsgate Terrace
- 269 Jaramillo Ct
- 2420 Pebble Springs Ct
- 9232 Onyx Point Ct
- 9208 Onyx Point Ct
- 9219 Sapphire Hills Ct
- 9231 Sapphire Hills Ct
- 9207 Sapphire Hills Ct
- 9244 Onyx Point Ct
- 9221 Onyx Point Ct
- 9209 Onyx Point Ct
- 9243 Sapphire Hills Ct
- 9245 Onyx Point Ct
- 9218 Sapphire Hills Ct
- 9222 Kingston Rd
- 9230 Sapphire Hills Ct
- 9210 Kingston Rd
- 9234 Kingston Rd
- 9206 Sapphire Hills Ct
- 9242 Sapphire Hills Ct
- 9246 Kingston Rd
- 3150 E Serene Ave
- 3120 E Serene Ave