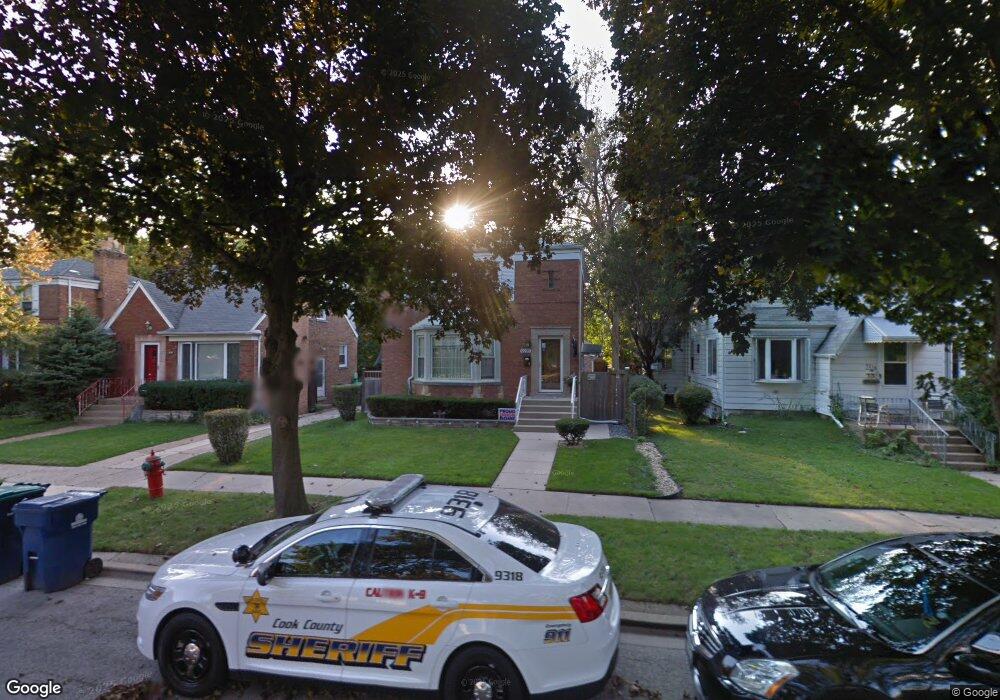
9220 S Sawyer Ave Evergreen Park, IL 60805
Estimated Value: $324,505 - $376,000
3
Beds
2
Baths
1,800
Sq Ft
$194/Sq Ft
Est. Value
About This Home
This home is located at 9220 S Sawyer Ave, Evergreen Park, IL 60805 and is currently estimated at $349,626, approximately $194 per square foot. 9220 S Sawyer Ave is a home located in Cook County with nearby schools including Northwest Elementary School, Central Jr High School, and Evergreen Park High School.
Ownership History
Date
Name
Owned For
Owner Type
Purchase Details
Closed on
Nov 11, 2021
Sold by
Rhodes Monica D and Rhodes Derrick Christopher
Bought by
Rhodes Monica D and Rhodes Derrick Christopher
Current Estimated Value
Home Financials for this Owner
Home Financials are based on the most recent Mortgage that was taken out on this home.
Original Mortgage
$175,421
Outstanding Balance
$159,900
Interest Rate
2.62%
Mortgage Type
FHA
Estimated Equity
$189,726
Purchase Details
Closed on
Jul 23, 2010
Sold by
Phelan Michael Patrick
Bought by
Rhodes Monica D
Home Financials for this Owner
Home Financials are based on the most recent Mortgage that was taken out on this home.
Original Mortgage
$205,236
Interest Rate
5.5%
Mortgage Type
FHA
Purchase Details
Closed on
Mar 20, 2000
Sold by
Phelan Margaret M
Bought by
Phelan Margaret M
Create a Home Valuation Report for This Property
The Home Valuation Report is an in-depth analysis detailing your home's value as well as a comparison with similar homes in the area
Home Values in the Area
Average Home Value in this Area
Purchase History
| Date | Buyer | Sale Price | Title Company |
|---|---|---|---|
| Rhodes Monica D | -- | National Title Solutions Inc | |
| Rhodes Monica D | $208,000 | First American Title | |
| Phelan Margaret M | -- | -- |
Source: Public Records
Mortgage History
| Date | Status | Borrower | Loan Amount |
|---|---|---|---|
| Open | Rhodes Monica D | $175,421 | |
| Closed | Rhodes Monica D | $205,236 |
Source: Public Records
Tax History Compared to Growth
Tax History
| Year | Tax Paid | Tax Assessment Tax Assessment Total Assessment is a certain percentage of the fair market value that is determined by local assessors to be the total taxable value of land and additions on the property. | Land | Improvement |
|---|---|---|---|---|
| 2024 | $7,400 | $23,287 | $3,281 | $20,006 |
| 2023 | $5,600 | $25,000 | $3,281 | $21,719 |
| 2022 | $5,600 | $17,570 | $2,812 | $14,758 |
| 2021 | $5,444 | $17,570 | $2,812 | $14,758 |
| 2020 | $5,325 | $17,570 | $2,812 | $14,758 |
| 2019 | $5,932 | $18,704 | $2,577 | $16,127 |
| 2018 | $5,811 | $18,704 | $2,577 | $16,127 |
| 2017 | $6,118 | $19,722 | $2,577 | $17,145 |
| 2016 | $5,540 | $16,490 | $2,109 | $14,381 |
| 2015 | $5,501 | $16,490 | $2,109 | $14,381 |
| 2014 | $5,389 | $16,490 | $2,109 | $14,381 |
| 2013 | $6,019 | $19,479 | $2,109 | $17,370 |
Source: Public Records
Map
Nearby Homes
- 9252 S Sawyer Ave
- 9250 S Kedzie Ave
- 9227 S Turner Ave
- 9146 S Spaulding Ave
- 9206 S Troy Ave
- 9148 S Troy Ave
- 9100 S Kedzie Ave
- 9258 S Albany Ave
- 9210 S Trumbull Ave
- 9431 S Turner Ave
- 9205 S Utica Ave
- 9412 S Homan Ave
- 9322 S Trumbull Ave
- 9252 S Sacramento Ave
- 9258 S Sacramento Ave
- 45 Steeple Bend Ln
- 9100 S Saint Louis Ave
- 9117 S Clifton Park Ave
- 9427 S Saint Louis Ave
- 9521 S Sawyer Ave
- 9216 S Sawyer Ave
- 9216 S Sawyer Ave
- 9224 S Sawyer Ave
- 9228 S Sawyer Ave
- 9228 S Sawyer Ave
- 9212 S Sawyer Ave
- 9212 S Sawyer Ave
- 9232 S Sawyer Ave
- 9232 S Sawyer Ave
- 9225 S Spaulding Ave
- 9225 S Spaulding Ave
- 9219 S Spaulding Ave
- 9219 S Spaulding Ave
- 9208 S Sawyer Ave
- 9208 S Sawyer Ave
- 9215 S Spaulding Ave
- 9215 S Spaulding Ave
- 9236 S Sawyer Ave
- 9204 S Sawyer Ave
- 9204 S Sawyer Ave