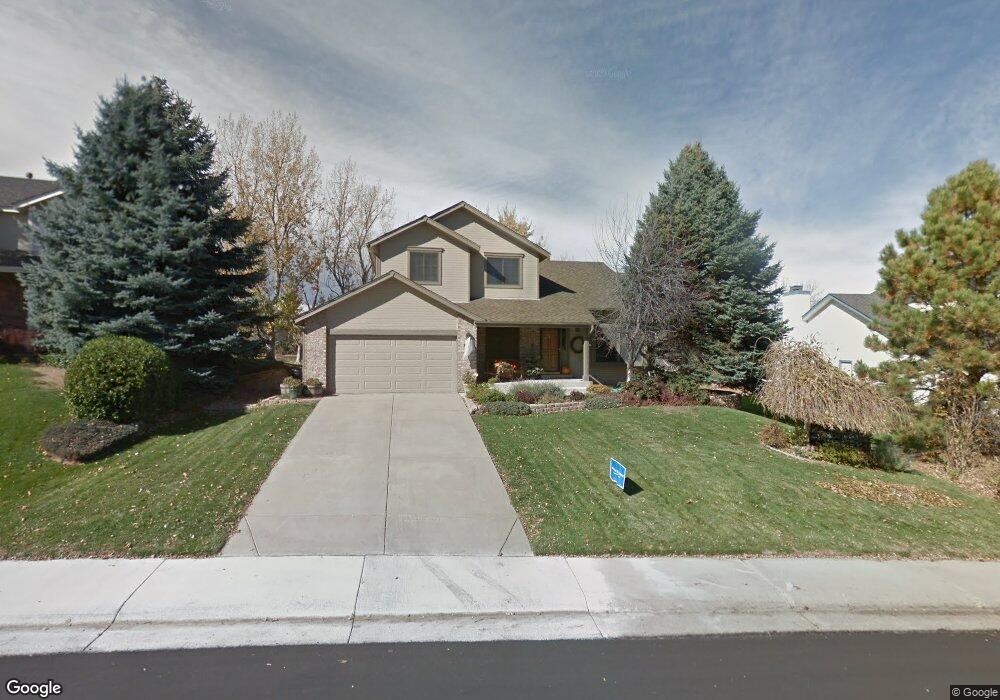
9221 Crestmore Way Highlands Ranch, CO 80126
Northridge NeighborhoodEstimated Value: $701,000 - $838,000
4
Beds
3
Baths
2,191
Sq Ft
$345/Sq Ft
Est. Value
About This Home
This home is located at 9221 Crestmore Way, Highlands Ranch, CO 80126 and is currently estimated at $756,287, approximately $345 per square foot. 9221 Crestmore Way is a home located in Douglas County with nearby schools including Northridge Elementary School, Mountain Ridge Middle School, and Mountain Vista High School.
Ownership History
Date
Name
Owned For
Owner Type
Purchase Details
Closed on
Sep 29, 1993
Sold by
Owen Edward S and Owen Ellen Marie
Bought by
Leydon Thomas P and Leydon Audrey M
Current Estimated Value
Home Financials for this Owner
Home Financials are based on the most recent Mortgage that was taken out on this home.
Original Mortgage
$169,575
Interest Rate
7.11%
Purchase Details
Closed on
Sep 28, 1993
Sold by
Owen Edward Steven and Owen Ellen Mari
Bought by
Leydon Thomas P and Leydon Audrey M
Home Financials for this Owner
Home Financials are based on the most recent Mortgage that was taken out on this home.
Original Mortgage
$169,575
Interest Rate
7.11%
Purchase Details
Closed on
May 23, 1988
Sold by
Clift Richard S and Clift Margaret R
Bought by
Marie Edward Steven Owen and Marie Edward Ellen
Purchase Details
Closed on
Sep 19, 1986
Sold by
Mission Viejo Co
Bought by
Richard S 7 Margar Clift
Create a Home Valuation Report for This Property
The Home Valuation Report is an in-depth analysis detailing your home's value as well as a comparison with similar homes in the area
Home Values in the Area
Average Home Value in this Area
Purchase History
| Date | Buyer | Sale Price | Title Company |
|---|---|---|---|
| Leydon Thomas P | $178,500 | -- | |
| Leydon Thomas P | $178,500 | -- | |
| Marie Edward Steven Owen | $139,000 | -- | |
| Richard S 7 Margar Clift | $150,100 | -- |
Source: Public Records
Mortgage History
| Date | Status | Borrower | Loan Amount |
|---|---|---|---|
| Closed | Leydon Thomas P | $169,575 |
Source: Public Records
Tax History Compared to Growth
Tax History
| Year | Tax Paid | Tax Assessment Tax Assessment Total Assessment is a certain percentage of the fair market value that is determined by local assessors to be the total taxable value of land and additions on the property. | Land | Improvement |
|---|---|---|---|---|
| 2024 | $4,155 | $54,470 | $13,070 | $41,400 |
| 2023 | $4,147 | $54,470 | $13,070 | $41,400 |
| 2022 | $2,855 | $38,190 | $8,780 | $29,410 |
| 2021 | $3,630 | $38,190 | $8,780 | $29,410 |
| 2020 | $3,445 | $37,140 | $9,310 | $27,830 |
| 2019 | $3,457 | $37,140 | $9,310 | $27,830 |
| 2018 | $3,015 | $31,900 | $8,030 | $23,870 |
| 2017 | $2,745 | $31,900 | $8,030 | $23,870 |
| 2016 | $2,698 | $30,770 | $8,970 | $21,800 |
| 2015 | $2,756 | $30,770 | $8,970 | $21,800 |
| 2014 | $2,350 | $24,230 | $4,990 | $19,240 |
Source: Public Records
Map
Nearby Homes
- 9361 Crestmore Way
- 1146 Cherry Blossom Ct
- 996 Cherry Blossom Ct
- 8982 Sunset Ridge Ct
- 966 Cherry Blossom Ct
- 867 Summer Dr Unit 9C
- 9191 Hickory Cir
- 842 Summer Dr Unit 3E
- 9151 Weatherstone Ct
- 669 Walden Ct
- 745 Stowe St
- 9170 Stargrass Cir
- 2105 Weatherstone Cir
- 2226 Thistle Ridge Cir
- 9492 Joyce Ln
- 9510 Joyce Ln
- 8837 Cactus Flower Way
- 495 Ridgeglen Way
- 540 Snowy Owl Place
- 2249 Weatherstone Cir
- 9231 Crestmore Way
- 9211 Crestmore Way
- 9241 Crestmore Way
- 9222 Crestmore Way
- 9232 Crestmore Way
- 9212 Crestmore Way
- 9251 Crestmore Way
- 1435 Goldsmith Dr
- 1435 E Goldsmith Dr
- 1425 Goldsmith Dr
- 1455 Goldsmith Dr
- 9252 Crestmore Way
- 9202 Crestmore Way
- 1405 Goldsmith Dr
- 1475 Goldsmith Dr
- 9223 Montrose Way
- 9213 Montrose Way
- 9261 Crestmore Way
- 9233 Montrose Way
- 9262 Crestmore Way