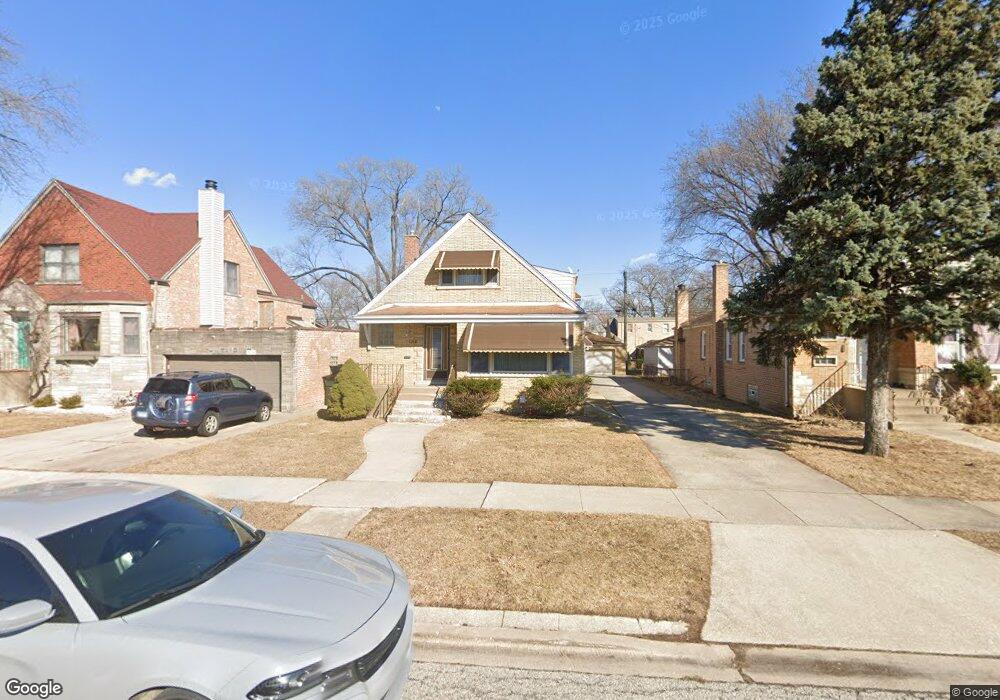
9221 S Albany Ave Evergreen Park, IL 60805
Estimated Value: $281,000 - $316,731
4
Beds
2
Baths
1,429
Sq Ft
$210/Sq Ft
Est. Value
About This Home
This home is located at 9221 S Albany Ave, Evergreen Park, IL 60805 and is currently estimated at $299,433, approximately $209 per square foot. 9221 S Albany Ave is a home located in Cook County with nearby schools including Northeast Elementary School, Central Jr High School, and Evergreen Park High School.
Ownership History
Date
Name
Owned For
Owner Type
Purchase Details
Closed on
Mar 26, 2003
Sold by
The Provident Bank
Bought by
Kora Mathai K and Mathai Mariamma K
Current Estimated Value
Home Financials for this Owner
Home Financials are based on the most recent Mortgage that was taken out on this home.
Original Mortgage
$148,000
Outstanding Balance
$61,241
Interest Rate
5.25%
Mortgage Type
New Conventional
Estimated Equity
$238,192
Purchase Details
Closed on
May 10, 2000
Sold by
Old Kent Bank
Bought by
Christian Fabienne
Home Financials for this Owner
Home Financials are based on the most recent Mortgage that was taken out on this home.
Original Mortgage
$153,000
Interest Rate
8.56%
Mortgage Type
Balloon
Purchase Details
Closed on
Nov 17, 1994
Sold by
Przybyla Raymond S and Przybyla Loretta M
Bought by
First National Bank Of Evergreen Park
Create a Home Valuation Report for This Property
The Home Valuation Report is an in-depth analysis detailing your home's value as well as a comparison with similar homes in the area
Home Values in the Area
Average Home Value in this Area
Purchase History
| Date | Buyer | Sale Price | Title Company |
|---|---|---|---|
| Kora Mathai K | $185,000 | First American Title | |
| Christian Fabienne | $180,000 | -- | |
| First National Bank Of Evergreen Park | -- | -- |
Source: Public Records
Mortgage History
| Date | Status | Borrower | Loan Amount |
|---|---|---|---|
| Open | Kora Mathai K | $148,000 | |
| Previous Owner | Christian Fabienne | $153,000 |
Source: Public Records
Tax History Compared to Growth
Tax History
| Year | Tax Paid | Tax Assessment Tax Assessment Total Assessment is a certain percentage of the fair market value that is determined by local assessors to be the total taxable value of land and additions on the property. | Land | Improvement |
|---|---|---|---|---|
| 2024 | $8,191 | $24,000 | $4,480 | $19,520 |
| 2023 | $7,713 | $24,000 | $4,480 | $19,520 |
| 2022 | $7,713 | $19,490 | $3,840 | $15,650 |
| 2021 | $7,451 | $19,490 | $3,840 | $15,650 |
| 2020 | $7,173 | $19,490 | $3,840 | $15,650 |
| 2019 | $7,583 | $19,525 | $3,520 | $16,005 |
| 2018 | $7,431 | $19,525 | $3,520 | $16,005 |
| 2017 | $7,308 | $19,525 | $3,520 | $16,005 |
| 2016 | $6,457 | $16,309 | $2,880 | $13,429 |
| 2015 | $6,470 | $16,309 | $2,880 | $13,429 |
| 2014 | $6,314 | $16,309 | $2,880 | $13,429 |
| 2013 | $6,702 | $18,762 | $2,880 | $15,882 |
Source: Public Records
Map
Nearby Homes
- 9258 S Albany Ave
- 9205 S Utica Ave
- 9252 S Sacramento Ave
- 9206 S Troy Ave
- 9258 S Sacramento Ave
- 9148 S Troy Ave
- 9250 S Kedzie Ave
- 9241 S Richmond Ave
- 9252 S Sawyer Ave
- 9100 S Kedzie Ave
- 9045 S Sacramento Ave
- 9227 S Turner Ave
- 45 Steeple Bend Ln
- 9431 S Turner Ave
- 9516 S Francisco Ave
- 9558 S Sacramento Ave
- 8841 S Utica Ave
- 9602 S Troy Ave
- 9412 S Homan Ave
- 9210 S Trumbull Ave
- 9225 S Albany Ave
- 9215 S Albany Ave
- 9231 S Albany Ave
- 9211 S Albany Ave
- 9233 S Albany Ave
- 9209 S Albany Ave
- 9220 S Utica Ave
- 9232 S Utica Ave
- 9216 S Utica Ave
- 9238 S Utica Ave
- 9238 S Utica Ave
- 9235 S Albany Ave
- 9207 S Albany Ave
- 9214 S Albany Ave
- 9212 S Utica Ave
- 9220 S Albany Ave
- 9228 S Albany Ave
- 9240 S Utica Ave
- 9241 S Albany Ave
- 9208 S Utica Ave