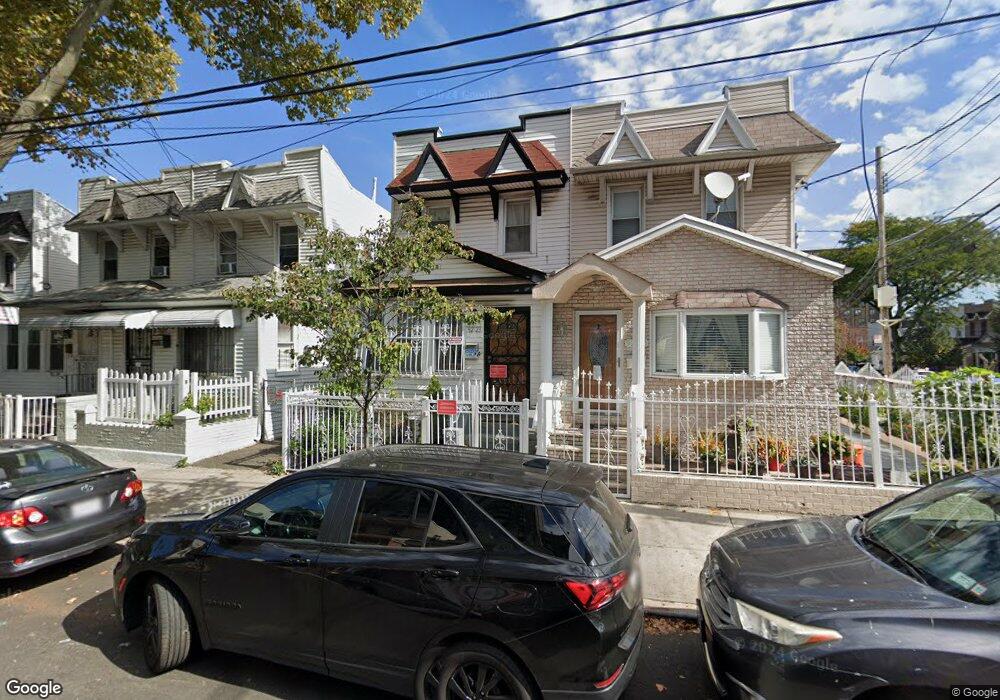
9223 168th Place Jamaica, NY 11433
Jamaica NeighborhoodEstimated Value: $676,000 - $816,000
--
Bed
--
Bath
1,328
Sq Ft
$539/Sq Ft
Est. Value
About This Home
This home is located at 9223 168th Place, Jamaica, NY 11433 and is currently estimated at $715,433, approximately $538 per square foot. 9223 168th Place is a home located in Queens County with nearby schools including P.S./I.S. 116 William C Hughley and I.S. 238 Susan B Anthony Academy.
Ownership History
Date
Name
Owned For
Owner Type
Purchase Details
Closed on
Sep 10, 2021
Sold by
Hai Abdul and Hai Rona Nasrin
Bought by
Begum Shahida and Begum Hai Abdul
Current Estimated Value
Purchase Details
Closed on
Sep 14, 2016
Sold by
Barnes Delia and Barnes James
Bought by
Hai Abdul and Rona Nasrin
Home Financials for this Owner
Home Financials are based on the most recent Mortgage that was taken out on this home.
Original Mortgage
$357,600
Outstanding Balance
$285,821
Interest Rate
3.45%
Mortgage Type
Purchase Money Mortgage
Estimated Equity
$429,612
Purchase Details
Closed on
Dec 11, 1998
Sold by
Port Realty Group Llc
Bought by
Barnes James and Barnes Delia
Home Financials for this Owner
Home Financials are based on the most recent Mortgage that was taken out on this home.
Original Mortgage
$173,500
Interest Rate
6.75%
Mortgage Type
FHA
Purchase Details
Closed on
Feb 11, 1998
Sold by
Lew Martin
Bought by
Port Realty Group Llc
Create a Home Valuation Report for This Property
The Home Valuation Report is an in-depth analysis detailing your home's value as well as a comparison with similar homes in the area
Home Values in the Area
Average Home Value in this Area
Purchase History
| Date | Buyer | Sale Price | Title Company |
|---|---|---|---|
| Begum Shahida | -- | -- | |
| Hai Abdul | $447,000 | -- | |
| Barnes James | $175,000 | -- | |
| Port Realty Group Llc | $105,500 | First American Title Ins Co |
Source: Public Records
Mortgage History
| Date | Status | Borrower | Loan Amount |
|---|---|---|---|
| Open | Hai Abdul | $357,600 | |
| Previous Owner | Barnes James | $173,500 |
Source: Public Records
Tax History Compared to Growth
Tax History
| Year | Tax Paid | Tax Assessment Tax Assessment Total Assessment is a certain percentage of the fair market value that is determined by local assessors to be the total taxable value of land and additions on the property. | Land | Improvement |
|---|---|---|---|---|
| 2025 | $4,490 | $23,682 | $5,603 | $18,079 |
| 2024 | $4,490 | $22,356 | $5,646 | $16,710 |
| 2023 | $4,360 | $21,709 | $5,032 | $16,677 |
| 2022 | $4,088 | $37,080 | $10,320 | $26,760 |
| 2021 | $4,154 | $35,820 | $10,320 | $25,500 |
| 2020 | $4,177 | $30,780 | $10,320 | $20,460 |
| 2019 | $3,897 | $32,460 | $10,320 | $22,140 |
| 2018 | $3,688 | $18,091 | $6,779 | $11,312 |
| 2017 | $3,179 | $17,067 | $6,480 | $10,587 |
| 2016 | $2,978 | $17,067 | $6,480 | $10,587 |
| 2015 | $1,722 | $16,446 | $7,833 | $8,613 |
| 2014 | $1,722 | $15,525 | $7,128 | $8,397 |
Source: Public Records
Map
Nearby Homes
- 9219 168th Place
- 168-68 92nd Rd
- 16823 93rd Ave
- 168-63 93rd Ave
- 8927 168th St
- 8900 170th St Unit 7N
- 153-10 89th Ave
- 89-00 170th St Unit 7D
- 89-00 170th St Unit 6k
- 172-18 Jamaica Ave Unit 2-B
- 166-12 Douglas Ave
- 89-02 171st St
- 17207a 90th Ave
- 88-30 172nd St
- 89-00 170 St Unit 11N
- 89-00 170 St Unit 10-M
- 89-00 170 St Unit 2N
- 89-00 170 St Unit 11F
- 89-00 170 St Unit 5K
- 89-00 170 St Unit 12L
- 9221 168th Place
- 92-21 168th Place
- 9225 168th Place
- 9219 168th Place
- 92-19 168th Place
- 16841 92nd Rd
- 9217 168th Place
- 16843 92nd Rd
- 9215 168th Place
- 16845 92nd Rd
- 9213 168th Place
- 9233 168th Place
- 16847 92nd Rd
- 92-26 168th Place
- 9211 168th Place
- 92-22 168th Place
- 92-51 168th Place
- 9235 168th Place
- 16849 92nd Rd
- 9224 168th Place