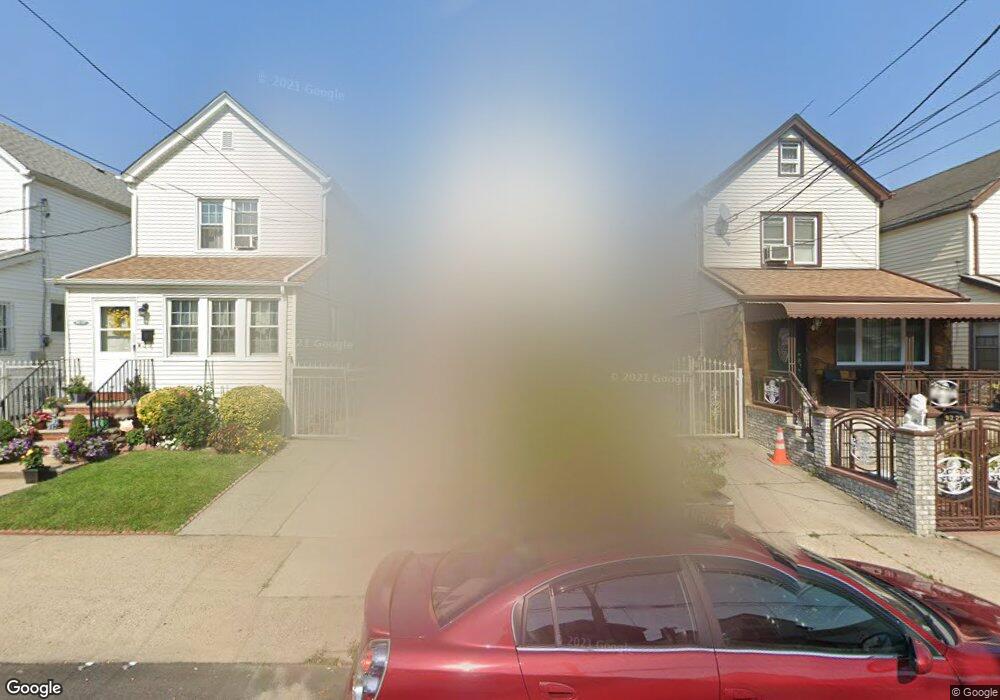
9227 212th Place Queens Village, NY 11428
Queens Village NeighborhoodEstimated Value: $685,000 - $802,000
3
Beds
2
Baths
1,120
Sq Ft
$657/Sq Ft
Est. Value
About This Home
This home is located at 9227 212th Place, Queens Village, NY 11428 and is currently estimated at $736,016, approximately $657 per square foot. 9227 212th Place is a home located in Queens County with nearby schools including P.S. 33 Edward M. Funk, Jean Nuzzi Intermediate School, and Incarnation Catholic Academy.
Ownership History
Date
Name
Owned For
Owner Type
Purchase Details
Closed on
Nov 16, 2006
Sold by
Yaqoob Mohammad
Bought by
Lochansingh Larry G
Current Estimated Value
Home Financials for this Owner
Home Financials are based on the most recent Mortgage that was taken out on this home.
Original Mortgage
$69,562
Outstanding Balance
$41,705
Interest Rate
6.36%
Estimated Equity
$694,311
Purchase Details
Closed on
Aug 23, 2002
Sold by
Des Development Corp
Bought by
Yaqoob Mohammad
Home Financials for this Owner
Home Financials are based on the most recent Mortgage that was taken out on this home.
Original Mortgage
$199,950
Interest Rate
6.18%
Purchase Details
Closed on
Oct 29, 2001
Sold by
Trumpf Olga Serocki
Bought by
Dse Development Corp
Create a Home Valuation Report for This Property
The Home Valuation Report is an in-depth analysis detailing your home's value as well as a comparison with similar homes in the area
Home Values in the Area
Average Home Value in this Area
Purchase History
| Date | Buyer | Sale Price | Title Company |
|---|---|---|---|
| Lochansingh Larry G | $463,750 | -- | |
| Lochansingh Larry G | $463,750 | -- | |
| Yaqoob Mohammad | -- | -- | |
| Yaqoob Mohammad | -- | -- | |
| Dse Development Corp | -- | -- | |
| Dse Development Corp | -- | -- |
Source: Public Records
Mortgage History
| Date | Status | Borrower | Loan Amount |
|---|---|---|---|
| Open | Lochansingh Larry G | $69,562 | |
| Closed | Lochansingh Larry G | $69,562 | |
| Open | Lochansingh Larry G | $371,000 | |
| Closed | Lochansingh Larry G | $371,000 | |
| Previous Owner | Yaqoob Mohammad | $199,950 |
Source: Public Records
Tax History Compared to Growth
Tax History
| Year | Tax Paid | Tax Assessment Tax Assessment Total Assessment is a certain percentage of the fair market value that is determined by local assessors to be the total taxable value of land and additions on the property. | Land | Improvement |
|---|---|---|---|---|
| 2025 | $5,516 | $30,257 | $7,287 | $22,970 |
| 2024 | $5,528 | $28,862 | $7,605 | $21,257 |
| 2023 | $5,220 | $27,389 | $7,341 | $20,048 |
| 2022 | $4,879 | $36,300 | $10,260 | $26,040 |
| 2021 | $5,150 | $35,280 | $10,260 | $25,020 |
| 2020 | $5,041 | $32,040 | $10,260 | $21,780 |
| 2019 | $4,739 | $32,280 | $10,260 | $22,020 |
| 2018 | $4,355 | $22,824 | $8,217 | $14,607 |
| 2017 | $4,096 | $21,565 | $8,195 | $13,370 |
| 2016 | $4,001 | $21,565 | $8,195 | $13,370 |
| 2015 | $2,234 | $21,012 | $9,284 | $11,728 |
| 2014 | $2,234 | $20,044 | $10,377 | $9,667 |
Source: Public Records
Map
Nearby Homes
- 91-03 212th St
- 9022 Hollis Court Blvd
- 91-19 215th Place
- 9001 215th St
- 89-91 215th Place
- 89-38 212th St
- 8935 210th Place
- 89-16 214th St
- 9013 209th St
- 90-54 209th St
- 211-35 99th Ave
- 90-60 209th St
- 99-02 212 St
- 99-02 212th St
- 9904 212th St
- 93-22 217th St
- 92-24 218th St
- 88-52 212th St
- 88-49 212th Place
- 99-11 213th St Unit 1
- 9227 212th Place
- 9223 212th Place
- 9229 212th Place
- 9221 212th Place
- 9231 212th Place
- 9219 212th Place
- 9233 212th Place
- 9233 212th Place
- 9215 212th Place
- 9237 212th Place
- 9228 212th Place
- 9226 212th Place
- 9213 212th Place
- 92-13 212th Place Unit 2 FL
- 9228 213th St
- 9224 213th St
- 9224 212th Place
- 9224 212th Place
- 9230 213th St
- 9222 213th St