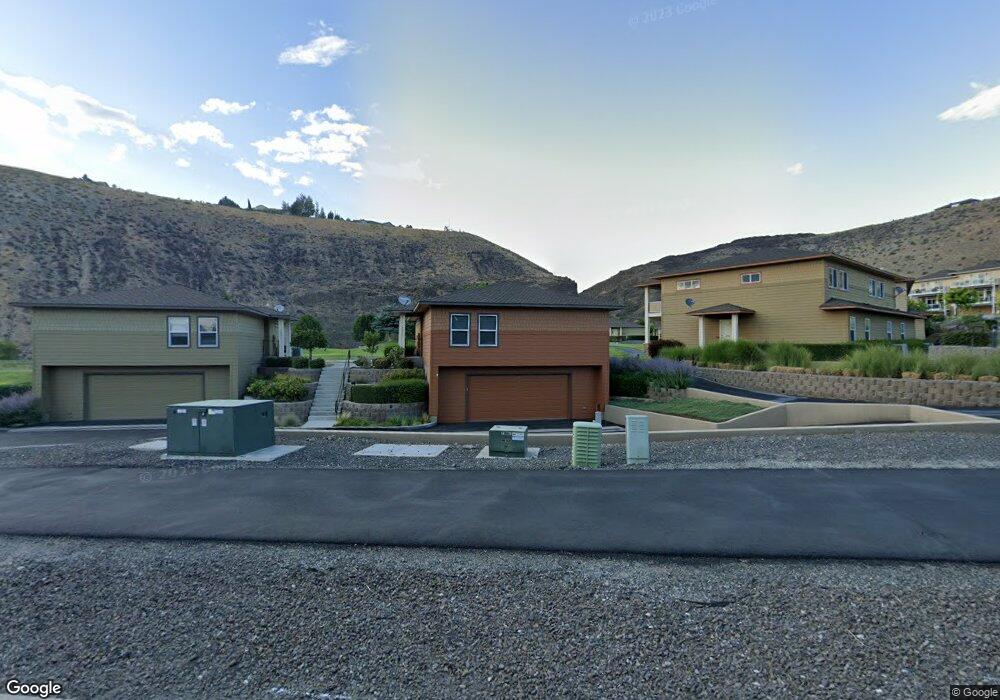
9227 Crescent Bar Rd NW Unit C-00 Quincy, WA 98848
Estimated Value: $558,606 - $681,000
2
Beds
2
Baths
1,282
Sq Ft
$484/Sq Ft
Est. Value
About This Home
This home is located at 9227 Crescent Bar Rd NW Unit C-00, Quincy, WA 98848 and is currently estimated at $620,902, approximately $484 per square foot. 9227 Crescent Bar Rd NW Unit C-00 is a home located in Grant County with nearby schools including Monument Elementary School, Pioneer Elementary School, and Quincy Middle School.
Ownership History
Date
Name
Owned For
Owner Type
Purchase Details
Closed on
May 20, 2016
Sold by
Ennis Robert S and Ennis Sandy J
Bought by
Three Rays Investment Llc
Current Estimated Value
Home Financials for this Owner
Home Financials are based on the most recent Mortgage that was taken out on this home.
Original Mortgage
$237,000
Outstanding Balance
$193,659
Interest Rate
4.5%
Mortgage Type
New Conventional
Estimated Equity
$427,243
Purchase Details
Closed on
Jul 23, 2007
Sold by
Crescent Canyon Development Llc
Bought by
Ennis Robert S and Ennis Sandy J
Home Financials for this Owner
Home Financials are based on the most recent Mortgage that was taken out on this home.
Original Mortgage
$286,800
Interest Rate
6.73%
Mortgage Type
Purchase Money Mortgage
Purchase Details
Closed on
Feb 14, 2007
Sold by
Canyonview At Crescent Bar Llc
Bought by
Crescent Canyon Development Llc
Purchase Details
Closed on
Sep 25, 2006
Sold by
Canyonview At Crescent Bar Llc
Bought by
Canyonview At Crescent Bar Llc
Create a Home Valuation Report for This Property
The Home Valuation Report is an in-depth analysis detailing your home's value as well as a comparison with similar homes in the area
Home Values in the Area
Average Home Value in this Area
Purchase History
| Date | Buyer | Sale Price | Title Company |
|---|---|---|---|
| Three Rays Investment Llc | $316,000 | Grant County Title | |
| Ennis Robert S | $444,945 | Security | |
| Crescent Canyon Development Llc | -- | Security Title Guaranty Inc | |
| Canyonview At Crescent Bar Llc | -- | Security Title Guaranty Inc |
Source: Public Records
Mortgage History
| Date | Status | Borrower | Loan Amount |
|---|---|---|---|
| Open | Three Rays Investment Llc | $237,000 | |
| Previous Owner | Ennis Robert S | $286,800 |
Source: Public Records
Tax History Compared to Growth
Tax History
| Year | Tax Paid | Tax Assessment Tax Assessment Total Assessment is a certain percentage of the fair market value that is determined by local assessors to be the total taxable value of land and additions on the property. | Land | Improvement |
|---|---|---|---|---|
| 2024 | $4,223 | $413,465 | $135,000 | $278,465 |
| 2023 | $3,323 | $312,295 | $135,000 | $177,295 |
| 2022 | $3,239 | $312,295 | $135,000 | $177,295 |
| 2021 | $3,418 | $312,295 | $135,000 | $177,295 |
| 2020 | $3,135 | $301,315 | $107,000 | $194,315 |
| 2019 | $3,327 | $293,990 | $107,000 | $186,990 |
| 2018 | $3,570 | $285,905 | $107,000 | $178,905 |
| 2017 | $3,534 | $287,750 | $107,000 | $180,750 |
| 2016 | $3,306 | $300,855 | $101,650 | $199,205 |
| 2013 | -- | $210,555 | $73,500 | $137,055 |
Source: Public Records
Map
Nearby Homes
- 9246 Red Cliff Dr NW Unit B66
- 9205 Red Cliff Dr NW Unit B50
- 23294 Sunserra Loop NW
- 23318 Sunserra Loop NW Unit B-00
- 9665 Ridgeview Dr NW
- 9604 Ridgeview Dr NW
- 23631 Canopy Dr NW Unit 40
- 23631 Canopy Dr NW Unit 22
- 23631 Canopy Dr NW Unit 41
- 9725 Ridgeview Dr NW
- 9112 Blue Heron Ln NW Unit A-65
- 9647 Ridgeview Dr NW
- 9122 Red Hawk Ln NW Unit A76
- 9133 Eagle Ln NW Unit C67
- 9108 Eagle Ln NW Unit A84
- 9159 Riverview Way NW Unit D39
- 9060 Trellis Ln NW
- 9773 Ridgeview Dr NW
- 23345 Spur Ln NW
- 23427 Canopy Dr NW
- 9227 Crescent Bar Rd NW
- 9213 Crescent Bar Rd NW
- 9213 Crescent Bar Rd NW Unit C01
- 23035 Sunserra Loop NW
- 23041 Sunserra Loop NW
- 23049 Sunserra Loop NW
- 23055 Sunserra Loop NW
- 23063 Sunserra Loop NW Unit C-06
- 23063 Sunserra Loop NW
- 23069 Sunserra Loop NW
- 9216 Canyon Dr NW
- 9240 Canyon Dr NW
- 9226 Canyon Dr NW
- 9246 Canyon Dr NW Unit C12
- 9203 Canyon Dr NW
- 23758 Crescent Bay Dr NW
- 9250 Canyon Dr NW
- 9213 Canyon Dr NW
- 23106 Sunserra Loop NW
- 9234 Canyon Dr NW