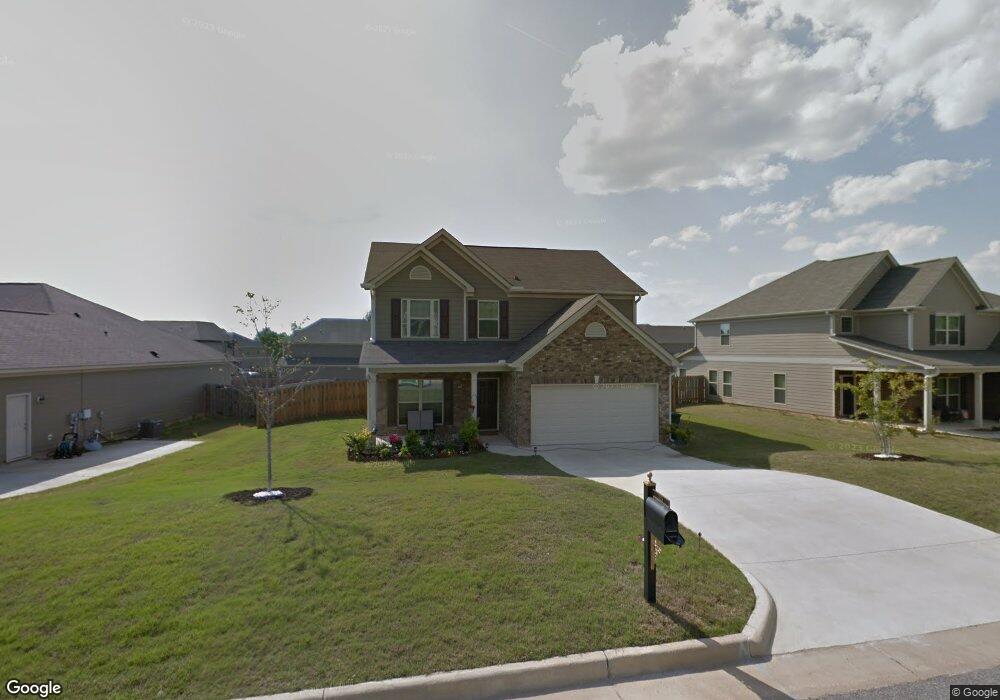
9229 Granite Field Ct Fortson, GA 31808
North Columbus NeighborhoodEstimated Value: $311,269 - $352,000
4
Beds
3
Baths
2,153
Sq Ft
$152/Sq Ft
Est. Value
About This Home
This home is located at 9229 Granite Field Ct, Fortson, GA 31808 and is currently estimated at $328,067, approximately $152 per square foot. 9229 Granite Field Ct is a home with nearby schools including North Columbus Elementary School, Veterans Memorial Middle School, and Northside High School.
Ownership History
Date
Name
Owned For
Owner Type
Purchase Details
Closed on
May 29, 2018
Sold by
Gilmore Brian J
Bought by
George Perry
Current Estimated Value
Home Financials for this Owner
Home Financials are based on the most recent Mortgage that was taken out on this home.
Original Mortgage
$211,000
Outstanding Balance
$182,480
Interest Rate
4.5%
Mortgage Type
VA
Estimated Equity
$145,587
Purchase Details
Closed on
Jun 4, 2015
Sold by
Hewett Timothy Dale
Bought by
Gilmore Brian J
Home Financials for this Owner
Home Financials are based on the most recent Mortgage that was taken out on this home.
Original Mortgage
$201,331
Interest Rate
3.88%
Mortgage Type
VA
Purchase Details
Closed on
Oct 9, 2012
Sold by
Grayhawk Homes Inc
Bought by
Hewett Timothy Dale and Hewett Shana C
Home Financials for this Owner
Home Financials are based on the most recent Mortgage that was taken out on this home.
Original Mortgage
$153,798
Interest Rate
3.6%
Mortgage Type
VA
Create a Home Valuation Report for This Property
The Home Valuation Report is an in-depth analysis detailing your home's value as well as a comparison with similar homes in the area
Home Values in the Area
Average Home Value in this Area
Purchase History
| Date | Buyer | Sale Price | Title Company |
|---|---|---|---|
| George Perry | $211,000 | -- | |
| Gilmore Brian J | $194,900 | -- | |
| Hewett Timothy Dale | $191,900 | -- |
Source: Public Records
Mortgage History
| Date | Status | Borrower | Loan Amount |
|---|---|---|---|
| Open | George Perry | $211,000 | |
| Previous Owner | Gilmore Brian J | $201,331 | |
| Previous Owner | Hewett Timothy Dale | $153,798 |
Source: Public Records
Tax History Compared to Growth
Tax History
| Year | Tax Paid | Tax Assessment Tax Assessment Total Assessment is a certain percentage of the fair market value that is determined by local assessors to be the total taxable value of land and additions on the property. | Land | Improvement |
|---|---|---|---|---|
| 2025 | -- | $101,252 | $14,868 | $86,384 |
| 2024 | -- | $101,252 | $14,868 | $86,384 |
| 2023 | $3,383 | $101,252 | $14,868 | $86,384 |
| 2022 | $2,949 | $84,620 | $14,868 | $69,752 |
| 2021 | $2,769 | $79,464 | $14,868 | $64,596 |
| 2020 | $2,767 | $79,360 | $14,868 | $64,492 |
| 2019 | $2,777 | $79,360 | $14,868 | $64,492 |
| 2018 | $2,777 | $79,360 | $14,868 | $64,492 |
| 2017 | $2,787 | $79,360 | $14,868 | $64,492 |
| 2016 | $2,707 | $76,760 | $16,000 | $60,760 |
| 2015 | $2,711 | $76,760 | $16,000 | $60,760 |
| 2014 | $2,715 | $76,760 | $16,000 | $60,760 |
| 2013 | -- | $76,760 | $16,000 | $60,760 |
Source: Public Records
Map
Nearby Homes
- 4677 Ivy Patch Dr
- 8000 Ivy Park Dr
- 9536 English Ivy Ct
- 8000 Climbing Ivy Ct
- 9410 Forest Crown Dr
- 9397 Forest Crown Dr
- 8848 Promenade Place
- 4559 Mountain Ivy Dr
- 4555 Mountain Ivy Dr
- 2993 Waterhill Dr
- 4040 Wooldridge Rd
- 4571 Carnoustie Ln
- 9700 Wooldridge Heights Dr
- 5905 Linley Ct
- 172-6 Almond Ridge Dr
- 8507 Galena Rd
- 3860 Essex Heights Trail
- 4824 Spring Ridge Ct
- 2040 Old Guard Rd
- 7847 Kolven Cove
- 9235 Granite Field Ct
- 9232 Granite Field Ct
- 4708 Ivy Patch Dr
- 9238 Granite Field Ct
- 4714 Ivy Patch Dr
- 9226 Granite Field Ct
- 9241 Granite Field Ct
- 9244 Granite Field Ct
- 4702 Ivy Patch Dr
- 9220 Granite Field Ct
- 4720 Ivy Patch Dr
- 9211 Granite Field Ct
- 9248 Granite Field Ct
- 4696 Ivy Patch Dr
- 4707 Ivy Patch Dr
- 9205 Granite Field Ct
- 9254 Granite Field Ct
- 4701 Ivy Patch Dr
- 4690 Ivy Patch Dr
- 9214 Granite Field Ct