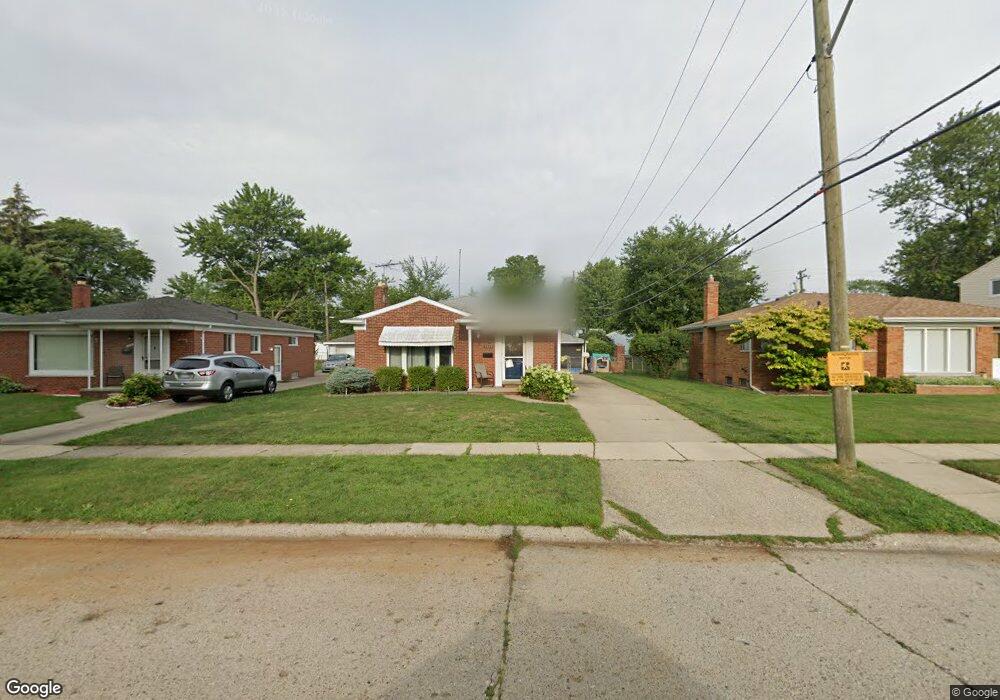
9229 Riverview Redford, MI 48239
Estimated Value: $182,677 - $217,000
Studio
1
Bath
1,288
Sq Ft
$159/Sq Ft
Est. Value
About This Home
This home is located at 9229 Riverview, Redford, MI 48239 and is currently estimated at $204,669, approximately $158 per square foot. 9229 Riverview is a home located in Wayne County with nearby schools including John D. Pierce Middle School, Lee M. Thurston High School, and Global Heights Academy.
Ownership History
Date
Name
Owned For
Owner Type
Purchase Details
Closed on
Nov 28, 2012
Sold by
The Estate Of Ruth A Ruggiero
Bought by
Hellen Amy
Current Estimated Value
Home Financials for this Owner
Home Financials are based on the most recent Mortgage that was taken out on this home.
Original Mortgage
$34,595
Outstanding Balance
$24,393
Interest Rate
3.75%
Mortgage Type
FHA
Estimated Equity
$180,276
Purchase Details
Closed on
May 12, 2004
Sold by
Ruggiero Patrick M and Ruggiero Ruth A
Bought by
Ruggiero Patrick M and Ruggiero Ruth A
Create a Home Valuation Report for This Property
The Home Valuation Report is an in-depth analysis detailing your home's value as well as a comparison with similar homes in the area
Home Values in the Area
Average Home Value in this Area
Purchase History
| Date | Buyer | Sale Price | Title Company |
|---|---|---|---|
| Hellen Amy | $40,000 | Greco Title Agency Llc | |
| Ruggiero Patrick M | -- | None Available |
Source: Public Records
Mortgage History
| Date | Status | Borrower | Loan Amount |
|---|---|---|---|
| Open | Hellen Amy | $34,595 |
Source: Public Records
Tax History
| Year | Tax Paid | Tax Assessment Tax Assessment Total Assessment is a certain percentage of the fair market value that is determined by local assessors to be the total taxable value of land and additions on the property. | Land | Improvement |
|---|---|---|---|---|
| 2025 | $1,034 | $94,900 | $0 | $0 |
| 2024 | $1,005 | $84,500 | $0 | $0 |
| 2023 | $961 | $73,100 | $0 | $0 |
| 2022 | $2,552 | $62,500 | $0 | $0 |
| 2021 | $2,824 | $59,900 | $0 | $0 |
| 2020 | $1,938 | $54,100 | $0 | $0 |
| 2019 | $1,897 | $41,300 | $0 | $0 |
| 2018 | $615 | $34,000 | $0 | $0 |
| 2017 | $2,126 | $31,300 | $0 | $0 |
| 2016 | $1,657 | $29,100 | $0 | $0 |
| 2015 | $2,581 | $27,200 | $0 | $0 |
| 2013 | $2,500 | $28,800 | $0 | $0 |
| 2012 | $1,817 | $31,800 | $7,900 | $23,900 |
Source: Public Records
Map
Nearby Homes
Your Personal Tour Guide
Ask me questions while you tour the home.