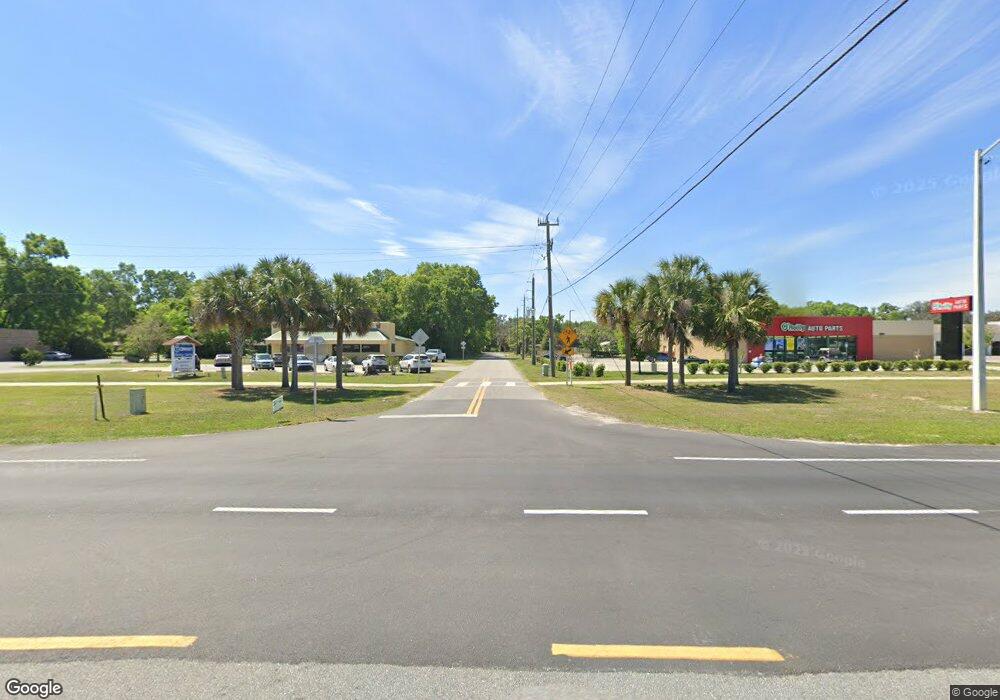
923.5 N Summit St Crescent City, FL 32112
--
Bed
--
Bath
1,200
Sq Ft
6
Acres
About This Home
This home is located at 923.5 N Summit St, Crescent City, FL 32112. 923.5 N Summit St is a home located in Putnam County with nearby schools including Middleton-Burney Elementary School, George C. Miller Jr. Intermediate School, and Crescent City Junior/Senior High School.
Ownership History
Date
Name
Owned For
Owner Type
Purchase Details
Closed on
Oct 31, 2023
Sold by
Jimmy And Leos Islands Properties Llc
Bought by
Br3 Of Orlando Ltd Lllp
Home Financials for this Owner
Home Financials are based on the most recent Mortgage that was taken out on this home.
Original Mortgage
$1,350,000
Outstanding Balance
$1,325,018
Interest Rate
7.19%
Mortgage Type
New Conventional
Purchase Details
Closed on
Aug 28, 2020
Sold by
Brandon Gas And Grocery Llc
Bought by
Jimmy And Leos Islands Properties Llc
Purchase Details
Closed on
Nov 20, 2019
Sold by
Putnam Center Crescent Llc
Bought by
Brandon Gas And Grocery Llc
Purchase Details
Closed on
Feb 16, 2000
Sold by
Supervalu Holdings Inc
Bought by
Putnam Center Crescent Llc
Home Financials for this Owner
Home Financials are based on the most recent Mortgage that was taken out on this home.
Original Mortgage
$3,900,000
Interest Rate
8.21%
Mortgage Type
Commercial
Create a Home Valuation Report for This Property
The Home Valuation Report is an in-depth analysis detailing your home's value as well as a comparison with similar homes in the area
Home Values in the Area
Average Home Value in this Area
Purchase History
| Date | Buyer | Sale Price | Title Company |
|---|---|---|---|
| Br3 Of Orlando Ltd Lllp | $2,700,000 | Fidelity National Title Of Flo | |
| Br3 Of Orlando Ltd Lllp | $2,700,000 | Fidelity National Title Of Flo | |
| Jimmy And Leos Islands Properties Llc | $1,496,300 | Attorney | |
| Brandon Gas And Grocery Llc | $1,386,000 | Novare Natl Setlement Svc | |
| Putnam Center Crescent Llc | $1,761,709 | -- |
Source: Public Records
Mortgage History
| Date | Status | Borrower | Loan Amount |
|---|---|---|---|
| Open | Br3 Of Orlando Ltd Lllp | $1,350,000 | |
| Closed | Br3 Of Orlando Ltd Lllp | $1,350,000 | |
| Previous Owner | Putnam Center Crescent Llc | $3,900,000 |
Source: Public Records
Tax History Compared to Growth
Tax History
| Year | Tax Paid | Tax Assessment Tax Assessment Total Assessment is a certain percentage of the fair market value that is determined by local assessors to be the total taxable value of land and additions on the property. | Land | Improvement |
|---|---|---|---|---|
| 2024 | $41,991 | $2,601,930 | $522,720 | $2,079,210 |
| 2023 | $32,935 | $1,448,760 | $522,720 | $926,040 |
| 2022 | $29,074 | $1,233,950 | $522,720 | $711,230 |
| 2021 | $29,459 | $1,232,580 | $0 | $0 |
| 2020 | $29,714 | $1,230,000 | $0 | $0 |
| 2019 | $35,347 | $1,391,800 | $1,246,710 | $145,090 |
| 2018 | $44,329 | $1,725,050 | $1,620,700 | $104,350 |
| 2017 | $43,665 | $1,666,160 | $1,561,810 | $104,350 |
| 2016 | $42,749 | $1,652,380 | $0 | $0 |
| 2015 | $42,919 | $1,651,327 | $0 | $0 |
| 2014 | $41,936 | $1,628,309 | $0 | $0 |
Source: Public Records
Map
Nearby Homes
- 405 Citron Ave
- 1101 N Summit St
- 605 N Summit St
- 1110 N Summit St Unit B26
- 1110 N Summit St Unit B13
- 1110 N Summit St Unit D37
- 1110 N Summit St Unit C34
- 000 Hunter Ave
- 601 Citron Ave
- 730 N Park St
- 000 Oakwood
- 0000 U S 17
- 2676 U S 17
- 410 Vernon Ave
- LOT 89 Huntington Rd
- 1098 County Road 308
- 128 Magnolia Ave
- 716 Grand Rondo W
- 120 Dunkle Snyder Rd
- 1009 Clemons Ln
- 925 Summit St
- 920 Oakwood St
- 910 Oakwood St
- 904 Oakwood St
- 1005 N Summit St
- 902 Oakwood St
- 940 Oakwood St
- 900 Oakwood St
- 411 Citron Ave
- 913 N Summit St
- 0 Grove Lot Lot60
- 0 Grove Lot
- 0 Grove Lot 61 & 70
- 700 Summit St
- 421 Citron Ave
- 901 Oakwood St
- 125 Lake Grove Dr
- 315 Grove Ave
- 1004 Summit St
- 204 Grove Ave