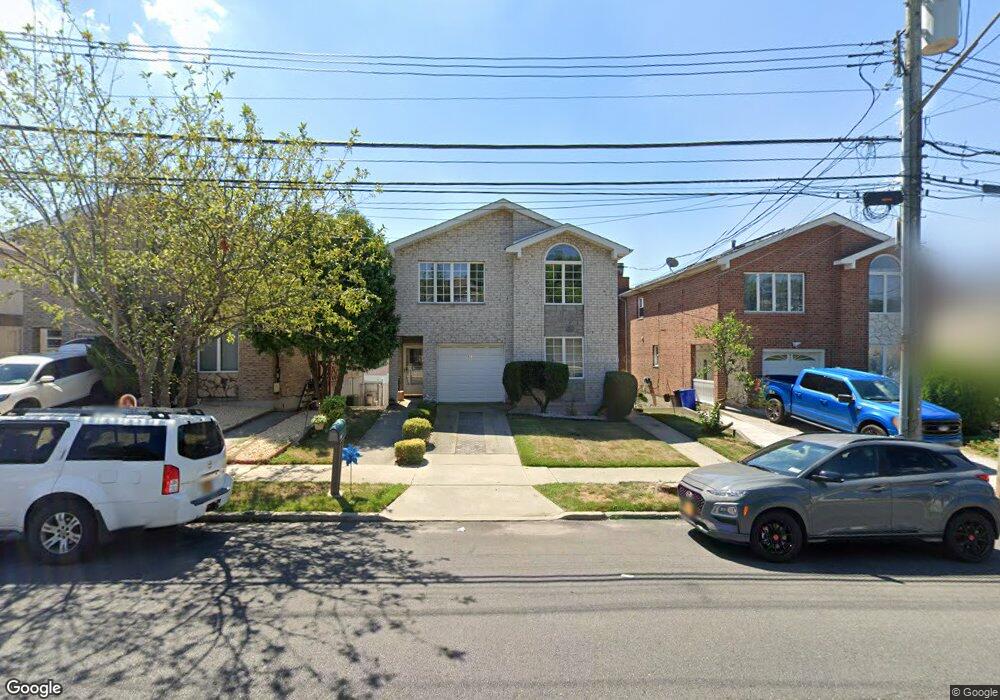
923 Bard Ave Staten Island, NY 10301
Silver Lake NeighborhoodEstimated Value: $1,188,000 - $1,564,000
--
Bed
4
Baths
4,331
Sq Ft
$312/Sq Ft
Est. Value
About This Home
This home is located at 923 Bard Ave, Staten Island, NY 10301 and is currently estimated at $1,353,205, approximately $312 per square foot. 923 Bard Ave is a home located in Richmond County with nearby schools including P.S. 45 John Tyler, Intermediate School 27, and Curtis High School.
Ownership History
Date
Name
Owned For
Owner Type
Purchase Details
Closed on
Apr 22, 2019
Sold by
King John R
Bought by
King John C
Current Estimated Value
Purchase Details
Closed on
Jun 10, 2000
Sold by
King John R and Pellegrino Bettyann
Bought by
King John R
Purchase Details
Closed on
Nov 8, 1996
Sold by
King John R and King Elizabeth M
Bought by
King John R and Pellegrino Bettyann
Create a Home Valuation Report for This Property
The Home Valuation Report is an in-depth analysis detailing your home's value as well as a comparison with similar homes in the area
Home Values in the Area
Average Home Value in this Area
Purchase History
| Date | Buyer | Sale Price | Title Company |
|---|---|---|---|
| King John C | -- | Narrows Abstract Inc | |
| King John R | -- | -- | |
| King John R | -- | -- |
Source: Public Records
Tax History Compared to Growth
Tax History
| Year | Tax Paid | Tax Assessment Tax Assessment Total Assessment is a certain percentage of the fair market value that is determined by local assessors to be the total taxable value of land and additions on the property. | Land | Improvement |
|---|---|---|---|---|
| 2025 | $11,275 | $87,300 | $18,398 | $68,902 |
| 2024 | $11,275 | $75,780 | $20,401 | $55,379 |
| 2023 | $11,090 | $54,606 | $19,612 | $34,994 |
| 2022 | $10,284 | $75,840 | $27,540 | $48,300 |
| 2021 | $10,228 | $70,860 | $27,540 | $43,320 |
| 2020 | $10,287 | $71,940 | $27,540 | $44,400 |
| 2019 | $7,848 | $62,520 | $27,540 | $34,980 |
| 2018 | $7,536 | $45,505 | $22,079 | $23,426 |
| 2017 | $7,681 | $42,930 | $23,182 | $19,748 |
| 2016 | $7,032 | $40,500 | $27,540 | $12,960 |
| 2015 | $6,476 | $41,320 | $27,156 | $14,164 |
| 2014 | $6,476 | $38,983 | $26,508 | $12,475 |
Source: Public Records
Map
Nearby Homes
- 40 Greenway Dr
- 64 Greenway Dr
- 967 Bard Ave
- 26 Fairway Ln
- 1000 Clove Rd Unit LO
- 1000 Clove Rd Unit 3G
- 1000 Clove Rd Unit 2D
- 1000 Clove Rd Unit 6G
- 1000 Clove Rd Unit 6 O & 6 P
- 1000 Clove Rd Unit 3F
- 1000 Clove Rd Unit 5B
- 1000 Clove Rd Unit 7G
- 1000 Clove Rd Unit LLC
- 1000 Clove Rd Unit 5C
- 1000 Clove Rd Unit 4P
- 1000 Clove Rd Unit 5N
- 1000 Clove Rd Unit 4E
- 1000 Clove Rd Unit 5D
- 1000 Clove Rd Unit 8C
- 1000 Clove Rd Unit 10N