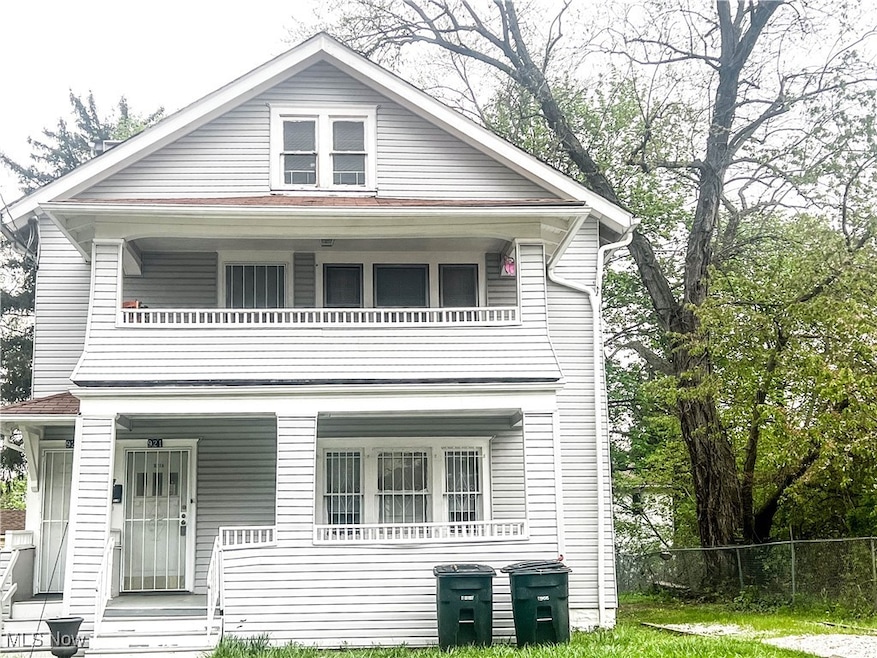
923 Baughman St Unit C Akron, OH 44320
West Akron NeighborhoodAbout This Home
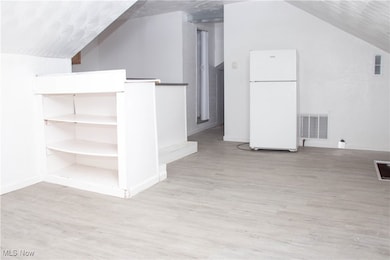
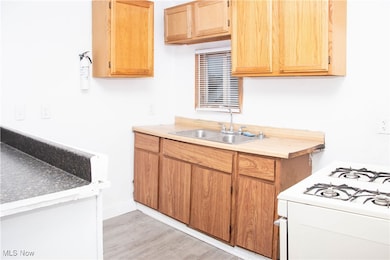
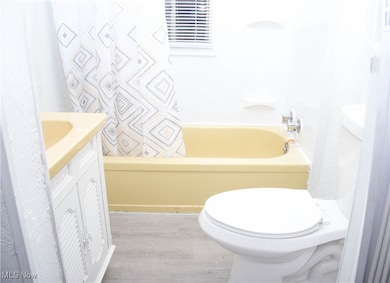
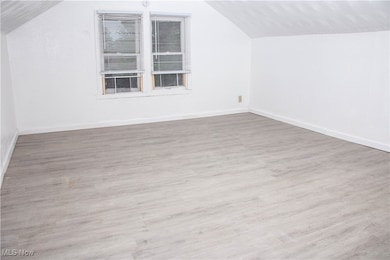
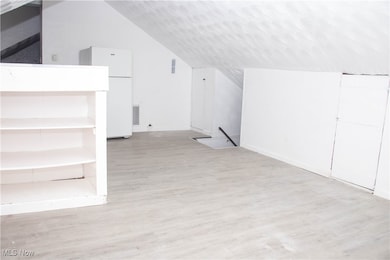
Discover comfortable and affordable living in this well-maintained 1 bedroom, 1 bathroom upstairs unit located in West Akron. This apartment features a functional layout, a spacious living area, and a nicely sized bedroom. Enjoy convenient access to local shopping, parks, restaurants, and public transportation. Section 8 is accepted, and this home is ready for immediate move-in. Don’t miss your chance to secure a clean, comfortable place to call home!
Listing Agent
Keller Williams Legacy Group Realty Brokerage Email: alishamoorer@kw.com, 234-565-8286 License #2023001586 Listed on: 11/03/2025

Property Details
Home Type
- Multi-Family
Est. Annual Taxes
- $17,162
Year Built
- Built in 1928
Lot Details
- 6,251 Sq Ft Lot
Bedrooms and Bathrooms
- 1 Bedroom
- 1 Full Bathroom
Utilities
- No Cooling
- Heating Available
Community Details
- Highland Park Subdivision
- No Laundry Facilities
Listing and Financial Details
- 12 Month Lease Term
- Assessor Parcel Number 6725152
Map
Source: MLS Now
MLS Number: 5169365
APN: 67-25152
Disclaimer: Certain information contained herein is derived from information provided by parties other than Homes.com. All information provided is deemed reliable, but is not guaranteed to be accurate and should be independently verified.
![]() IDX information is provided exclusively for personal, non-commercial use, and may not be used for any purpose other than to identify prospective properties consumers may be interested in purchasing. Information is deemed reliable but not guaranteed.
IDX information is provided exclusively for personal, non-commercial use, and may not be used for any purpose other than to identify prospective properties consumers may be interested in purchasing. Information is deemed reliable but not guaranteed.
- 916 Peckham St Unit 918
- 888 Peckham St
- 875 Orrin St
- 867 Orrin St
- 910 Bye St
- 414 Beechwood Dr
- 885 Bye St Unit 887
- 320 Wildwood Ave
- 900 Work Dr
- 434 Hillwood Dr
- 359 Beechwood Dr
- 890 Work Dr
- 408 Bacon Ave
- 908 Stadelman Ave
- 962 Stadelman Ave
- 295 Noble Ave
- 573 Madison Ave
- 1017 Stadelman Ave
- 453 Briarwood Dr
- 524 Auld Farm Cir
- 384 Grace Ave
- 441 Wildwood Ave
- 336 Madison Ave
- 774 Copley Rd
- 833 Work Dr Unit 835
- 896 Delia Ave Unit 3
- 985 Delia Ave
- 1055 Whittier Ave
- 713 Crosby St Unit ID1061099P
- 678 Crosby St Unit 3
- 999 W Exchange St Unit 2
- 627 Crosby St
- 1076 Jefferson Ave Unit 6
- 73 Beck Ave Unit 2
- 730 Noble Ave
- 162 Westwood Ave Unit 164
- 796 W Market St Unit A
- 794 W Market St Unit B
- 733 W Market St
- 636 Fern St Unit 638