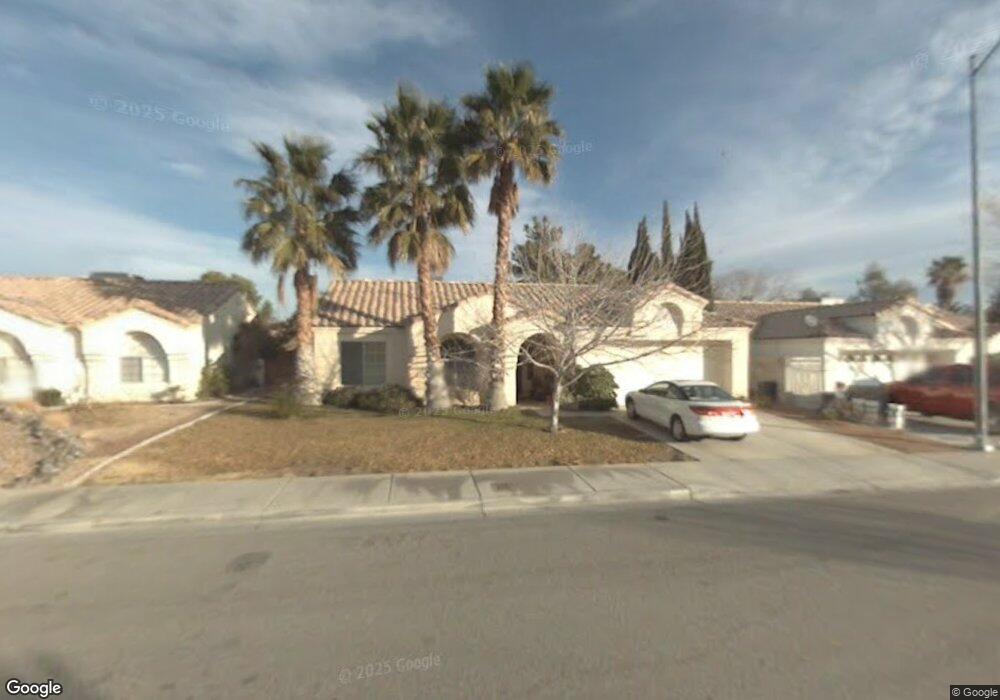
923 Chaps Cir Henderson, NV 89002
Highland Hills NeighborhoodEstimated Value: $336,000 - $384,000
3
Beds
2
Baths
1,293
Sq Ft
$284/Sq Ft
Est. Value
About This Home
This home is located at 923 Chaps Cir, Henderson, NV 89002 and is currently estimated at $367,697, approximately $284 per square foot. 923 Chaps Cir is a home located in Clark County with nearby schools including Fay Galloway Elementary School, Jack & Terry Mannion Middle School, and Foothill High School.
Ownership History
Date
Name
Owned For
Owner Type
Purchase Details
Closed on
Aug 25, 2021
Sold by
Greenfield Terri Ann and Hoit Tamara Lea
Bought by
Hoit Tamara L and Greenfield Terri Ann
Current Estimated Value
Home Financials for this Owner
Home Financials are based on the most recent Mortgage that was taken out on this home.
Original Mortgage
$155,000
Outstanding Balance
$139,413
Interest Rate
2.9%
Mortgage Type
Stand Alone Refi Refinance Of Original Loan
Estimated Equity
$228,284
Purchase Details
Closed on
Jun 28, 2021
Sold by
Hoit Greg
Bought by
Hoit Tamara Lea
Home Financials for this Owner
Home Financials are based on the most recent Mortgage that was taken out on this home.
Original Mortgage
$155,000
Outstanding Balance
$139,413
Interest Rate
2.9%
Mortgage Type
Stand Alone Refi Refinance Of Original Loan
Estimated Equity
$228,284
Purchase Details
Closed on
Jun 11, 2020
Sold by
Vorbau Kathryn L
Bought by
Vorbau Kathryn and Hoit Tamara
Create a Home Valuation Report for This Property
The Home Valuation Report is an in-depth analysis detailing your home's value as well as a comparison with similar homes in the area
Home Values in the Area
Average Home Value in this Area
Purchase History
| Date | Buyer | Sale Price | Title Company |
|---|---|---|---|
| Hoit Tamara L | -- | None Available | |
| Hoit Tamara Lea | -- | Stewart Title Company Fo | |
| Greenfield Terri Ann | $300,000 | Stewart Title Company Fo | |
| Vorbau Kathryn | -- | None Available |
Source: Public Records
Mortgage History
| Date | Status | Borrower | Loan Amount |
|---|---|---|---|
| Open | Hoit Tamara Lea | $155,000 |
Source: Public Records
Tax History
| Year | Tax Paid | Tax Assessment Tax Assessment Total Assessment is a certain percentage of the fair market value that is determined by local assessors to be the total taxable value of land and additions on the property. | Land | Improvement |
|---|---|---|---|---|
| 2026 | $1,592 | $85,109 | $34,300 | $50,809 |
| 2025 | $1,545 | $79,769 | $26,950 | $52,819 |
| 2024 | $1,501 | $79,769 | $26,950 | $52,819 |
| 2023 | $1,501 | $84,204 | $33,950 | $50,254 |
| 2022 | $1,457 | $73,811 | $27,300 | $46,511 |
| 2021 | $1,415 | $67,097 | $22,750 | $44,347 |
| 2020 | $1,370 | $66,648 | $22,400 | $44,248 |
| 2019 | $1,331 | $63,791 | $19,950 | $43,841 |
| 2018 | $1,292 | $59,013 | $16,450 | $42,563 |
| 2017 | $1,685 | $58,115 | $14,700 | $43,415 |
| 2016 | $1,224 | $52,460 | $8,750 | $43,710 |
| 2015 | $1,221 | $44,299 | $8,750 | $35,549 |
| 2014 | $1,185 | $39,935 | $7,350 | $32,585 |
Source: Public Records
Map
Nearby Homes
- 915 High Plains Dr
- 812 Arrowhead Trail
- 940 Rifle Dr
- 911 Wagon Train Dr
- 951 High Plains Dr
- 836 Cherry Dr
- 599 Marsh Creek Ct Unit 3A
- 630 Bighorn Creek St
- 828 Singing Drum Dr
- 713 Strawberry Place
- 686 Lunar Lake Way
- 984 Mackenzie Creek Ave
- 540 Big Lake St
- 532 Big Lake St
- 718 Bighorn Creek St
- 988 Roaring River Ave
- 1007 Winding Hill St
- 0 College Dr
- 648 Sunrise Lake Place
- 918 Calamity Jane Ln
Your Personal Tour Guide
Ask me questions while you tour the home.