923 Domingo Ct Turlock, CA 95380
Estimated Value: $476,000 - $502,359
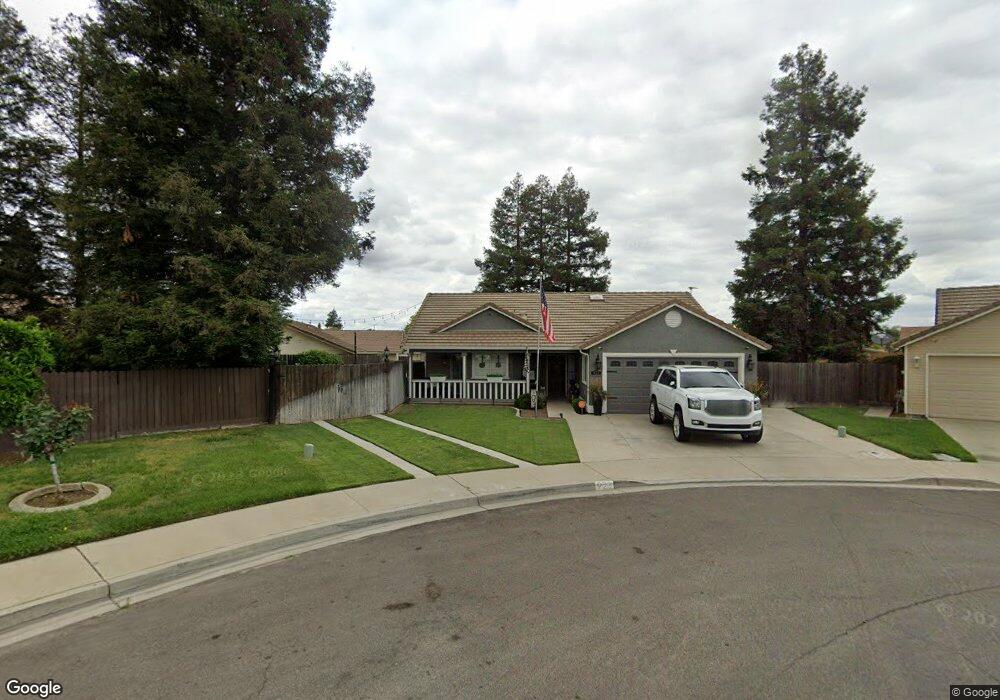
About This Home
This home is located at 923 Domingo Ct, Turlock, CA 95380 and is currently estimated at $488,340, approximately $334 per square foot. 923 Domingo Ct is a home located in Stanislaus County with nearby schools including Crowell Elementary School, Marvin A. Dutcher Middle School, and Turlock Junior High School.
Ownership History
We collect this data history from publicly available records. To have your information removed, we recommend requesting removal directly through your county’s website.
Purchase Details
Home Financials for this Owner
Home Financials are based on the most recent Mortgage that was taken out on this home.Purchase Details
Home Financials for this Owner
Home Financials are based on the most recent Mortgage that was taken out on this home.Purchase Details
Home Financials for this Owner
Home Financials are based on the most recent Mortgage that was taken out on this home.Purchase Details
Home Financials for this Owner
Home Financials are based on the most recent Mortgage that was taken out on this home.Purchase Details
Home Financials for this Owner
Home Financials are based on the most recent Mortgage that was taken out on this home.Purchase Details
Home Financials for this Owner
Home Financials are based on the most recent Mortgage that was taken out on this home.Purchase History
We collect this data history from publicly available records. To have your information removed, we recommend requesting removal directly through your county’s website.
| Date | Buyer | Sale Price | Title Company |
|---|---|---|---|
| -- | Old Republic Title | ||
| -- | None Listed On Document | ||
| -- | None Listed On Document | ||
| -- | Stewart Title Of California | ||
| $150,000 | Stewart Title Of California | ||
| $320,000 | Alliance Title Company | ||
| -- | Alliance Title Company | ||
| $292,000 | Chicago Title | ||
| -- | Alliance Title Company | ||
| -- | North American Title Co | ||
| $190,000 | North American Title Co | ||
| -- | Fidelity National Title Co | ||
| $115,000 | Fidelity National Title |
Mortgage History
We collect this data history from publicly available records. To have your information removed, we recommend requesting removal directly through your county’s website.
| Date | Status | Borrower | Loan Amount |
|---|---|---|---|
| Open | $240,000 | ||
| Previous Owner | $120,000 | ||
| Previous Owner | $304,000 | ||
| Previous Owner | $186,900 | ||
| Previous Owner | $174,170 | ||
| Previous Owner | $171,000 | ||
| Previous Owner | $25,623 | ||
| Previous Owner | $91,920 | ||
| Closed | $70,810 |
Tax History
We collect this data history from publicly available records. To have your information removed, we recommend requesting removal directly through your county’s website.
| Year | Tax Paid | Tax Assessment Tax Assessment Total Assessment is a certain percentage of the fair market value that is determined by local assessors to be the total taxable value of land and additions on the property. | Land | Improvement |
|---|---|---|---|---|
| 2025 | $4,939 | $458,440 | $222,853 | $235,587 |
| 2024 | $4,847 | $449,452 | $218,484 | $230,968 |
| 2023 | $4,840 | $440,640 | $214,200 | $226,440 |
| 2022 | $1,980 | $177,534 | $53,259 | $124,275 |
| 2021 | $1,951 | $174,054 | $52,215 | $121,839 |
| 2020 | $1,938 | $172,270 | $51,680 | $120,590 |
| 2019 | $1,906 | $168,893 | $50,667 | $118,226 |
| 2018 | $1,904 | $165,582 | $49,674 | $115,908 |
| 2017 | $1,860 | $162,336 | $48,700 | $113,636 |
| 2016 | $1,739 | $159,154 | $47,746 | $111,408 |
| 2015 | $1,724 | $156,764 | $47,029 | $109,735 |
| 2014 | $1,707 | $153,694 | $46,108 | $107,586 |
Map
- 1400 N Tully Rd Unit 116
- 1400 N Tully Rd Unit 43
- 1400 N Tully Rd Unit 114
- 2230 Aspenwood Dr
- 500 N Tully Rd Unit 64
- 500 N Tully Rd Unit 39
- 500 N Tully Rd Unit 64
- 2450 Fulkerth Rd
- 2400 Fulkerth Rd
- 300 N Soderquist Rd
- 200 N Tully Rd
- 2175 W Main St
- 900 W Canal Dr Unit 100
- 2202 Royal Wood Ln
- 3131 W Main St
- 1186 Kay Cir
- 2147 Sorrel Dr
- 2625 W Main St
- 350 West Ave N
- 2180 Oxford Ave
Ask me questions while you tour the home.