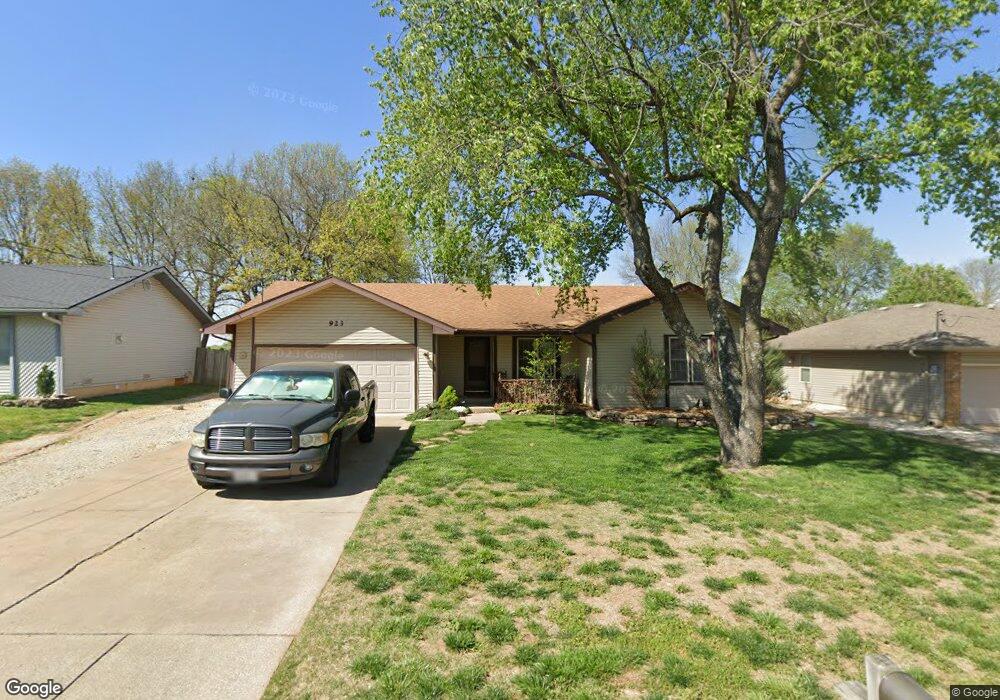
923 E Redbud Ln Springfield, MO 65803
Estimated Value: $221,000 - $233,000
3
Beds
2
Baths
1,448
Sq Ft
$156/Sq Ft
Est. Value
About This Home
This home is located at 923 E Redbud Ln, Springfield, MO 65803 and is currently estimated at $225,936, approximately $156 per square foot. 923 E Redbud Ln is a home located in Greene County with nearby schools including Truman Elementary School, Pleasant View K-8 School, and Hillcrest High School.
Ownership History
Date
Name
Owned For
Owner Type
Purchase Details
Closed on
Jan 21, 2020
Sold by
Bryan Alexandra and Bull Alexandra
Bought by
Bull Garrett
Current Estimated Value
Home Financials for this Owner
Home Financials are based on the most recent Mortgage that was taken out on this home.
Original Mortgage
$78,000
Interest Rate
2.8%
Mortgage Type
New Conventional
Purchase Details
Closed on
Feb 9, 2018
Sold by
Bull Garrett and Bull Alexander
Bought by
Bull Garrett O and Bull Alexandra L
Home Financials for this Owner
Home Financials are based on the most recent Mortgage that was taken out on this home.
Original Mortgage
$76,400
Interest Rate
3.95%
Mortgage Type
New Conventional
Purchase Details
Closed on
Jul 20, 2015
Sold by
Wekamp Dale D and Wekamp Anna L
Bought by
Buil Garrett
Purchase Details
Closed on
Dec 22, 2009
Sold by
Wekamp Dale D and Wekamp Anna L
Bought by
Barber Pamela Jean and Davis Michelle Ann
Create a Home Valuation Report for This Property
The Home Valuation Report is an in-depth analysis detailing your home's value as well as a comparison with similar homes in the area
Purchase History
| Date | Buyer | Sale Price | Title Company |
|---|---|---|---|
| Bull Garrett | -- | None Available | |
| Bull Garrett | -- | None Listed On Document | |
| Bull Garrett O | -- | None Available | |
| Buil Garrett | -- | None Available | |
| Barber Pamela Jean | -- | None Available |
Source: Public Records
Mortgage History
| Date | Status | Borrower | Loan Amount |
|---|---|---|---|
| Previous Owner | Bull Garrett | $78,000 | |
| Previous Owner | Bull Garrett O | $76,400 |
Source: Public Records
Tax History
| Year | Tax Paid | Tax Assessment Tax Assessment Total Assessment is a certain percentage of the fair market value that is determined by local assessors to be the total taxable value of land and additions on the property. | Land | Improvement |
|---|---|---|---|---|
| 2025 | $1,673 | $30,930 | $5,700 | $25,230 |
| 2024 | $1,634 | $28,220 | $3,800 | $24,420 |
| 2023 | $1,625 | $28,220 | $3,800 | $24,420 |
| 2022 | $1,467 | $24,970 | $3,800 | $21,170 |
| 2021 | $1,404 | $24,970 | $3,800 | $21,170 |
| 2020 | $1,277 | $21,570 | $3,800 | $17,770 |
| 2019 | $1,241 | $21,570 | $3,800 | $17,770 |
| 2018 | $1,047 | $18,110 | $3,230 | $14,880 |
| 2017 | $1,038 | $18,070 | $3,230 | $14,840 |
| 2016 | $1,034 | $18,070 | $3,230 | $14,840 |
| 2015 | $1,026 | $18,070 | $3,230 | $14,840 |
| 2014 | $1,029 | $18,010 | $3,230 | $14,780 |
Source: Public Records
Map
Nearby Homes
- 1039 E Caravan St
- 1103 E Smith St
- 1107 E Smith St
- 1113 E Smith St
- 1005 E McClernon St
- 1017 E McClernon St
- 1255 E Bonaire Dr
- 3764 N Huntington Ave
- 801 E Hill St
- 1270 E Ogorman Ct
- 1339 E McClernon St
- 1349 E Stoneridge St
- 3957 N Springlawn Ave
- 3969 N Springlawn Ave
- 1414 E Smith St
- 3749 N Pickwick Ave
- 3753 N Pickwick Ave
- 671 W Bridgewood Ct
- 3630 N Thistlewood Ct
- 4230 N Farm Road 159
- 931 E Redbud Ln
- 917 E Redbud Ln
- 909 E Redbud Ln
- 947 E Redbud Ln
- 924 E Redbud Ln
- 932 E Redbud Ln
- 916 E Redbud Ln
- 940 E Redbud Ln
- 0 Farm Road 159 Unit 60070240
- 908 E Redbud Ln
- 955 E Redbud Ln
- 948 E Redbud Ln
- 3505 N Farm Road 159
- 954 E Redbud Ln
- 963 E Redbud Ln
- 3461 N Farm Road 159
- 923 E Camorene St
- 931 E Camorene St
- 917 E Camorene St
- 964 E Redbud Ln
Your Personal Tour Guide
Ask me questions while you tour the home.