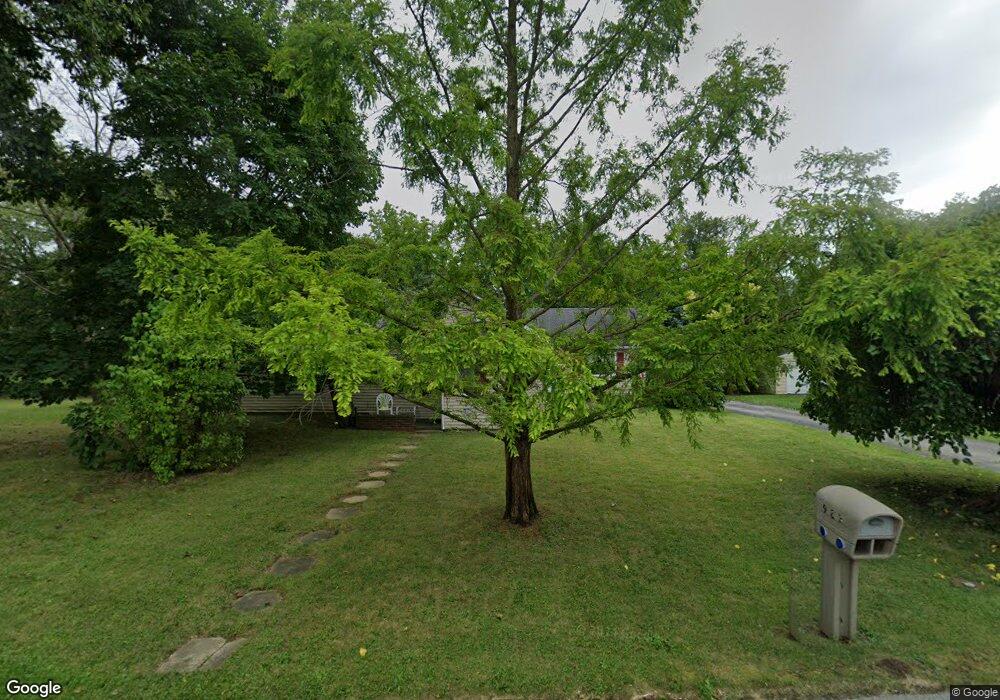
923 Gragg St Huntington, IN 46750
Estimated Value: $163,000 - $313,000
3
Beds
1
Bath
1,794
Sq Ft
$121/Sq Ft
Est. Value
About This Home
This home is located at 923 Gragg St, Huntington, IN 46750 and is currently estimated at $216,528, approximately $120 per square foot. 923 Gragg St is a home located in Huntington County with nearby schools including Flint Springs Elementary School, Crestview Middle School, and Huntington North High School.
Ownership History
Date
Name
Owned For
Owner Type
Purchase Details
Closed on
Jul 24, 2025
Sold by
Bair Erica M and Jackson Erica M
Bought by
Jackson Kevin W and Jackson Erica M
Current Estimated Value
Purchase Details
Closed on
Dec 5, 2024
Sold by
Bair Erica M
Bought by
Scheiber Brittanie and Mcglothin Patrick
Purchase Details
Closed on
Feb 29, 2016
Sold by
Wohlford Eric L and Wohlford Family Trust
Bought by
Bair Erica M
Create a Home Valuation Report for This Property
The Home Valuation Report is an in-depth analysis detailing your home's value as well as a comparison with similar homes in the area
Home Values in the Area
Average Home Value in this Area
Purchase History
| Date | Buyer | Sale Price | Title Company |
|---|---|---|---|
| Jackson Kevin W | -- | None Listed On Document | |
| Scheiber Brittanie | -- | None Listed On Document | |
| Scheiber Brittanie | $8,000 | None Listed On Document | |
| Bair Erica M | -- | None Available |
Source: Public Records
Tax History Compared to Growth
Tax History
| Year | Tax Paid | Tax Assessment Tax Assessment Total Assessment is a certain percentage of the fair market value that is determined by local assessors to be the total taxable value of land and additions on the property. | Land | Improvement |
|---|---|---|---|---|
| 2024 | $1,338 | $133,800 | $26,900 | $106,900 |
| 2023 | $1,192 | $119,200 | $26,900 | $92,300 |
| 2022 | $2,212 | $110,600 | $26,900 | $83,700 |
| 2021 | $2,108 | $105,400 | $26,900 | $78,500 |
| 2020 | $2,130 | $106,500 | $26,900 | $79,600 |
| 2019 | $1,898 | $94,900 | $26,900 | $68,000 |
| 2018 | $909 | $90,900 | $26,900 | $64,000 |
| 2017 | $903 | $90,300 | $26,900 | $63,400 |
| 2016 | $623 | $65,600 | $9,200 | $56,400 |
| 2014 | $571 | $62,900 | $9,200 | $53,700 |
| 2013 | $571 | $64,100 | $9,200 | $54,900 |
Source: Public Records
Map
Nearby Homes