Estimated Value: $78,000 - $116,204
3
Beds
1
Bath
1,438
Sq Ft
$69/Sq Ft
Est. Value
About This Home
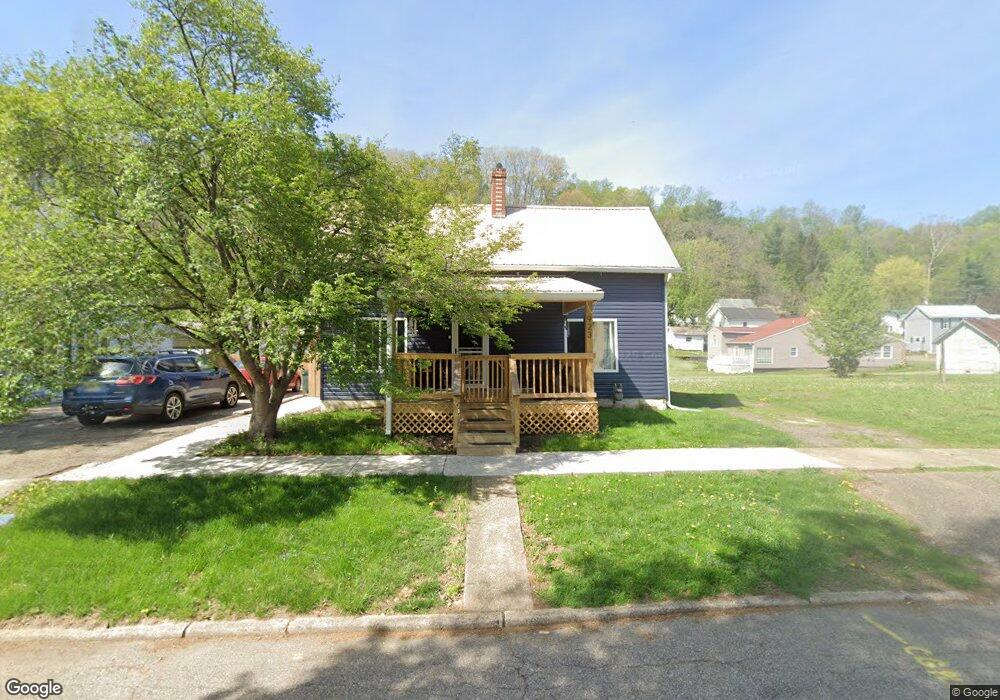
This home is located at 923 High St N, Malta, OH 43758 and is currently estimated at $98,801, approximately $68 per square foot. 923 High St N is a home located in Morgan County with nearby schools including Morgan High School.
Ownership History
Date
Name
Owned For
Owner Type
Purchase Details
Closed on
Jan 18, 2024
Sold by
Mayle Kathy and Mayle Ricky L
Bought by
Mayle Heath
Current Estimated Value
Purchase Details
Closed on
Dec 13, 2022
Sold by
North Eighth Rentals Inc
Bought by
Mayle Kathy
Purchase Details
Closed on
Aug 23, 2019
Sold by
North Eight Rentals Inc
Bought by
Blair Richard
Home Financials for this Owner
Home Financials are based on the most recent Mortgage that was taken out on this home.
Original Mortgage
$50,000
Interest Rate
3.7%
Mortgage Type
Land Contract Argmt. Of Sale
Purchase Details
Closed on
Mar 1, 2001
Sold by
Mitchell Kenny E
Bought by
Mitchell Wayne E
Purchase Details
Closed on
Feb 15, 2001
Sold by
Fox Richard A and Kay Brenda
Bought by
Mitchell Kenny E
Purchase Details
Closed on
Jun 22, 1998
Sold by
Calendine Beatrice Ann
Bought by
Fox Richard A and Brenda Kay
Create a Home Valuation Report for This Property
The Home Valuation Report is an in-depth analysis detailing your home's value as well as a comparison with similar homes in the area
Home Values in the Area
Average Home Value in this Area
Purchase History
| Date | Buyer | Sale Price | Title Company |
|---|---|---|---|
| Mayle Heath | -- | None Listed On Document | |
| Mayle Heath | -- | None Listed On Document | |
| Mayle Kathy | $6,000 | -- | |
| Blair Richard | $50,000 | None Available | |
| Mitchell Wayne E | -- | -- | |
| Mitchell Kenny E | $51,000 | -- | |
| Fox Richard A | $37,000 | -- |
Source: Public Records
Mortgage History
| Date | Status | Borrower | Loan Amount |
|---|---|---|---|
| Previous Owner | Blair Richard | $50,000 |
Source: Public Records
Tax History Compared to Growth
Tax History
| Year | Tax Paid | Tax Assessment Tax Assessment Total Assessment is a certain percentage of the fair market value that is determined by local assessors to be the total taxable value of land and additions on the property. | Land | Improvement |
|---|---|---|---|---|
| 2024 | $751 | $22,230 | $4,610 | $17,620 |
| 2023 | $751 | $13,870 | $3,720 | $10,150 |
| 2022 | $475 | $13,870 | $3,720 | $10,150 |
| 2021 | $535 | $15,470 | $3,720 | $11,750 |
| 2019 | $505 | $14,260 | $3,380 | $10,880 |
| 2018 | $487 | $14,260 | $3,380 | $10,880 |
| 2017 | $473 | $13,490 | $2,986 | $10,504 |
| 2016 | $474 | $13,490 | $2,986 | $10,504 |
| 2015 | $474 | $13,490 | $2,986 | $10,504 |
| 2014 | $487 | $13,490 | $2,986 | $10,504 |
| 2013 | $485 | $13,490 | $2,986 | $10,504 |
Source: Public Records
Map
Nearby Homes
- 307 11th St
- 6475 Ohio 669
- 3670 N State Route 60 NW
- 95 Sunset Dr
- 361 W Jefferson Ave
- 1096 N Kennebec Ave
- 1121 N Kennebec Ave
- 142 N 5th St
- 262 N 5th St
- 284 N Kennebec Ave
- 422 N Kennebec Ave
- 3955 Wedgewood Dr
- 41 W Bell Ave
- 3810 N Dugan Rd NW
- 274 N 8th St
- 346 E Union Ave
- 189 S 10th St
- 3470 N Terrace Dr NW
- 545 E Mcconnel Ave
- 112 S 16th St