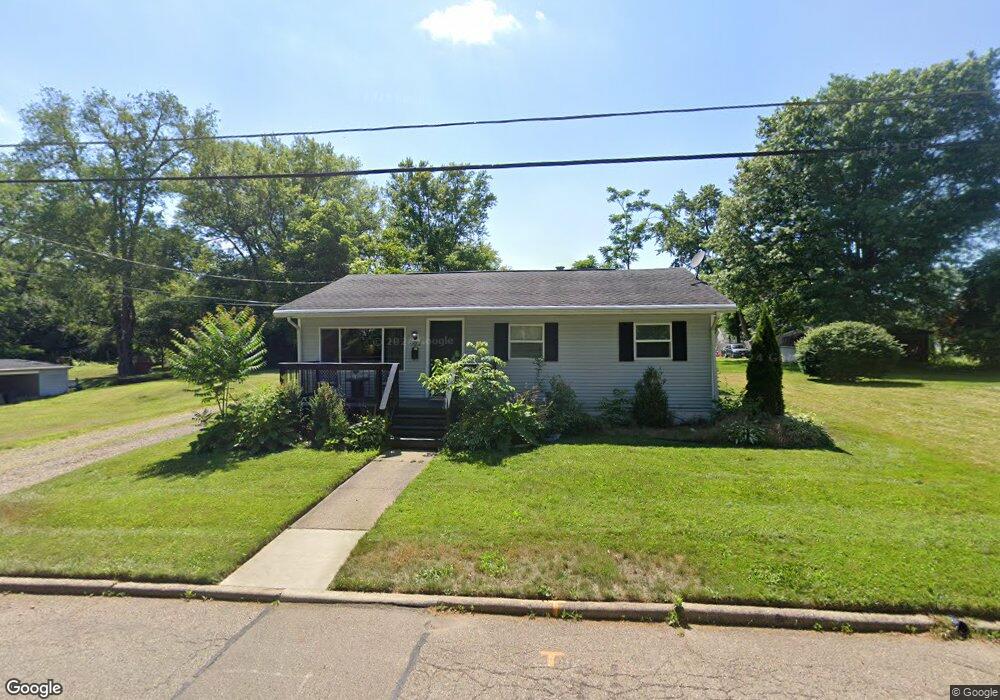
923 Johnson St SE Massillon, OH 44646
Downtown Massillon NeighborhoodEstimated Value: $80,000 - $133,000
2
Beds
1
Bath
1,008
Sq Ft
$104/Sq Ft
Est. Value
About This Home
This home is located at 923 Johnson St SE, Massillon, OH 44646 and is currently estimated at $104,694, approximately $103 per square foot. 923 Johnson St SE is a home located in Stark County with nearby schools including Massillon Intermediate School, Massillon Junior High School, and Washington High School.
Ownership History
Date
Name
Owned For
Owner Type
Purchase Details
Closed on
Aug 5, 2016
Sold by
Hinton Capital Investments
Bought by
Beaupre Valerie
Current Estimated Value
Home Financials for this Owner
Home Financials are based on the most recent Mortgage that was taken out on this home.
Original Mortgage
$66,768
Outstanding Balance
$53,187
Interest Rate
3.43%
Estimated Equity
$51,507
Purchase Details
Closed on
May 16, 2016
Sold by
Smedley Mark J
Bought by
Hinton Capital Investments Llc
Create a Home Valuation Report for This Property
The Home Valuation Report is an in-depth analysis detailing your home's value as well as a comparison with similar homes in the area
Home Values in the Area
Average Home Value in this Area
Purchase History
| Date | Buyer | Sale Price | Title Company |
|---|---|---|---|
| Beaupre Valerie | -- | -- | |
| Hinton Capital Investments Llc | $42,000 | None Available |
Source: Public Records
Mortgage History
| Date | Status | Borrower | Loan Amount |
|---|---|---|---|
| Open | Beaupre Valerie | $66,768 | |
| Closed | Beaupre Valerie | -- |
Source: Public Records
Tax History Compared to Growth
Tax History
| Year | Tax Paid | Tax Assessment Tax Assessment Total Assessment is a certain percentage of the fair market value that is determined by local assessors to be the total taxable value of land and additions on the property. | Land | Improvement |
|---|---|---|---|---|
| 2025 | -- | $28,500 | $5,780 | $22,720 |
| 2024 | -- | $28,500 | $5,780 | $22,720 |
| 2023 | $1,274 | $24,890 | $3,920 | $20,970 |
| 2022 | $1,277 | $24,890 | $3,920 | $20,970 |
| 2021 | $1,298 | $24,890 | $3,920 | $20,970 |
| 2020 | $1,114 | $20,100 | $3,190 | $16,910 |
| 2019 | $1,443 | $20,100 | $3,190 | $16,910 |
| 2018 | $1,092 | $20,100 | $3,190 | $16,910 |
| 2017 | $974 | $16,740 | $1,790 | $14,950 |
| 2016 | $1,052 | $17,300 | $1,440 | $15,860 |
| 2015 | $1,603 | $14,710 | $1,440 | $13,270 |
| 2014 | $1,495 | $15,120 | $1,470 | $13,650 |
| 2013 | $749 | $15,120 | $1,470 | $13,650 |
Source: Public Records
Map
Nearby Homes
- 1319 Walnut Rd SE
- 233 Edwin Ave SE
- 652 Young St SE
- 1274 13th St SE
- 17 Maple Ave SE
- 804 Erie St S
- 1225 Erie St S
- 0 Pearl SE Unit 5155028
- 824 Oak Ave SE
- 202 Rose Ave SE
- 1117 Cleveland St SW
- 832 Wellman Ave SE
- 46 5th St SE
- 22 Forest Ave SE
- 637 Wallace Ave SE
- 20 Forest Ave SE
- 1738 Erie St S
- 25 Forest Ave SE
- 21 Forest Ave SE
- 532 4th St SW
- 913 Johnson St SE
- 931 Johnson St SE
- 909 Johnson St SE
- 905 Johnson St SE
- 905 Johnson St SE
- 820 11th St SE
- 937 Johnson St SE
- 814 11th St SE
- 826 11th St SE
- 808 11th St SE
- 830 11th St SE
- 912 Johnson St SE
- 926 Johnson St SE
- 920 Johnson St SE
- 906 Johnson St SE
- 779 Johnson St SE
- 902 Johnson St SE
- 1114 Beckman St SE
- 1003 Johnson St SE
- 780 Johnson St SE