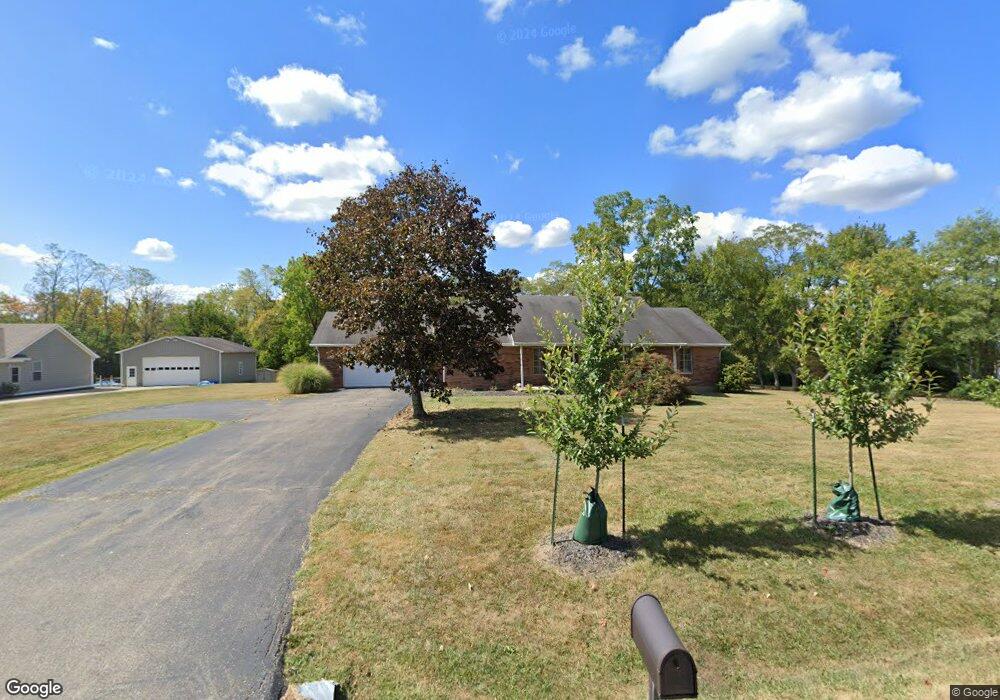
923 Middleboro Rd Oregonia, OH 45054
Washington Township NeighborhoodEstimated Value: $319,000 - $423,000
3
Beds
2
Baths
1,705
Sq Ft
$216/Sq Ft
Est. Value
About This Home
This home is located at 923 Middleboro Rd, Oregonia, OH 45054 and is currently estimated at $367,428, approximately $215 per square foot. 923 Middleboro Rd is a home located in Warren County with nearby schools including Little Miami Early Childhood Center, Little Miami Intermediate Middle School, and Little Miami Middle School.
Ownership History
Date
Name
Owned For
Owner Type
Purchase Details
Closed on
Jul 2, 2002
Sold by
Robinson Lloyd
Bought by
Barnes Lorie L
Current Estimated Value
Home Financials for this Owner
Home Financials are based on the most recent Mortgage that was taken out on this home.
Original Mortgage
$145,350
Outstanding Balance
$62,577
Interest Rate
6.93%
Mortgage Type
New Conventional
Estimated Equity
$304,851
Purchase Details
Closed on
Sep 23, 1999
Sold by
Smith Jessie E
Bought by
Robinson Lloyd
Purchase Details
Closed on
Sep 22, 1995
Sold by
Mcintosh Jerry W
Bought by
Smith Jessie E and Smith Elaine J
Home Financials for this Owner
Home Financials are based on the most recent Mortgage that was taken out on this home.
Original Mortgage
$106,000
Interest Rate
7.78%
Mortgage Type
New Conventional
Purchase Details
Closed on
Jul 16, 1993
Sold by
Berrey Berrey and Berrey Ruth E
Bought by
Mcintosh Mcintosh and Mcintosh Jerry W
Purchase Details
Closed on
Aug 11, 1988
Sold by
Berrey Berrey and Berrey Ruth E
Bought by
Mc Murray & Claudia Truste and Berrey Ruth E
Create a Home Valuation Report for This Property
The Home Valuation Report is an in-depth analysis detailing your home's value as well as a comparison with similar homes in the area
Home Values in the Area
Average Home Value in this Area
Purchase History
| Date | Buyer | Sale Price | Title Company |
|---|---|---|---|
| Barnes Lorie L | $153,000 | -- | |
| Robinson Lloyd | $144,500 | -- | |
| Smith Jessie E | $122,000 | -- | |
| Mcintosh Mcintosh | $19,000 | -- | |
| Mc Murray & Claudia Truste | -- | -- |
Source: Public Records
Mortgage History
| Date | Status | Borrower | Loan Amount |
|---|---|---|---|
| Open | Barnes Lorie L | $145,350 | |
| Previous Owner | Smith Jessie E | $106,000 |
Source: Public Records
Tax History Compared to Growth
Tax History
| Year | Tax Paid | Tax Assessment Tax Assessment Total Assessment is a certain percentage of the fair market value that is determined by local assessors to be the total taxable value of land and additions on the property. | Land | Improvement |
|---|---|---|---|---|
| 2024 | $3,528 | $86,830 | $24,020 | $62,810 |
| 2023 | $3,057 | $68,579 | $12,827 | $55,751 |
| 2022 | $2,996 | $68,579 | $12,828 | $55,752 |
| 2021 | $2,859 | $68,579 | $12,828 | $55,752 |
| 2020 | $2,743 | $55,755 | $10,430 | $45,325 |
| 2019 | $2,793 | $55,755 | $10,430 | $45,325 |
| 2018 | $2,878 | $55,755 | $10,430 | $45,325 |
| 2017 | $2,543 | $48,969 | $9,226 | $39,743 |
| 2016 | $2,600 | $48,969 | $9,226 | $39,743 |
| 2015 | $2,603 | $48,969 | $9,226 | $39,743 |
| 2014 | $2,730 | $45,860 | $8,720 | $37,140 |
| 2013 | $2,575 | $54,580 | $10,150 | $44,430 |
Source: Public Records
Map
Nearby Homes
- 702 Middleboro Rd
- 6487 Flint Trail
- 1015 Settlemyre Rd
- 732 Settlemyre Rd
- 6 Corwin Rd
- 1 Corwin Rd
- 6500 Olive Branch Rd
- 0 Meurer Field Blvd Unit 944143
- 0 Meurer Field Blvd Unit 1855974
- 339 S Nixon Camp Rd
- Lot C Blazing Trail
- Lot B Blazing Trail
- 8784 Wilmington Rd
- 9029 Arrowcreek Dr
- 8788 Wilmington Rd
- 8457 Strout Rd
- 5737 Brant Rd
- 7564 E Us Rt 22 & 3
- 137 S Waynesville Rd
- 0 E US Rt 22 & 3 Unit 1840943
- 915 Middleboro Rd
- 943 Middleboro Rd
- 983 Middleboro Rd
- 878 Middleboro Rd
- 2 Middleboro Rd
- 1 Middleboro Rd
- 919 Middleboro Rd
- 885 Middleboro Rd
- 992 Middleboro Rd
- 1005 Middleboro Rd
- 869 Middleboro Rd
- 989 Middleboro Rd
- 1055 Middleboro Rd
- 843 Middleboro Rd
- 825 Middleboro Rd
- 830 Middleboro Rd
- 1057 Middleboro Rd
- 994 Middleboro Rd
- 1109 Middleboro Rd
- 1064 Middleboro Rd