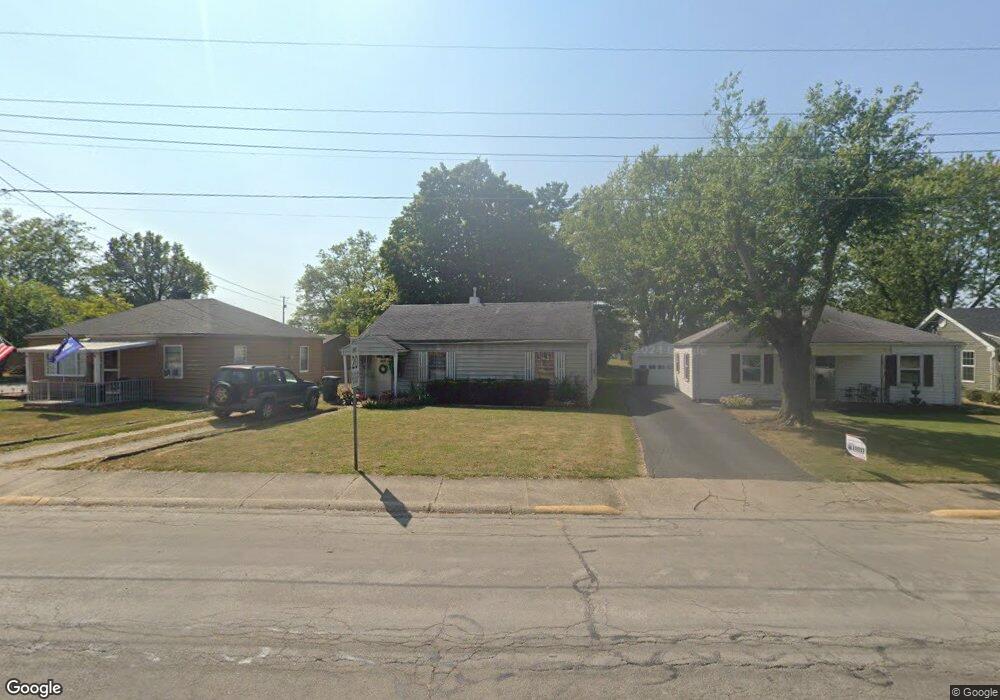
923 N Plum St Union City, IN 47390
Estimated Value: $61,482 - $88,000
2
Beds
1
Bath
816
Sq Ft
$90/Sq Ft
Est. Value
About This Home
This home is located at 923 N Plum St, Union City, IN 47390 and is currently estimated at $73,121, approximately $89 per square foot. 923 N Plum St is a home located in Randolph County with nearby schools including North Side Elementary School and Union City Community Jr/Sr High School.
Ownership History
Date
Name
Owned For
Owner Type
Purchase Details
Closed on
Dec 17, 2012
Sold by
Hoover Marlin C and Hoover Alicia A
Bought by
Hoover Property Rentals Llc
Current Estimated Value
Purchase Details
Closed on
Sep 3, 2005
Sold by
Bowlin Marleana
Bought by
Hoover Marlin C and Hoover Alicia A
Home Financials for this Owner
Home Financials are based on the most recent Mortgage that was taken out on this home.
Original Mortgage
$18,729
Outstanding Balance
$10,070
Interest Rate
5.93%
Mortgage Type
Future Advance Clause Open End Mortgage
Estimated Equity
$63,051
Create a Home Valuation Report for This Property
The Home Valuation Report is an in-depth analysis detailing your home's value as well as a comparison with similar homes in the area
Home Values in the Area
Average Home Value in this Area
Purchase History
| Date | Buyer | Sale Price | Title Company |
|---|---|---|---|
| Hoover Property Rentals Llc | -- | None Available | |
| Hoover Marlin C | -- | None Available |
Source: Public Records
Mortgage History
| Date | Status | Borrower | Loan Amount |
|---|---|---|---|
| Open | Hoover Marlin C | $18,729 |
Source: Public Records
Tax History Compared to Growth
Tax History
| Year | Tax Paid | Tax Assessment Tax Assessment Total Assessment is a certain percentage of the fair market value that is determined by local assessors to be the total taxable value of land and additions on the property. | Land | Improvement |
|---|---|---|---|---|
| 2024 | $342 | $17,100 | $4,500 | $12,600 |
| 2023 | $342 | $17,100 | $4,500 | $12,600 |
| 2022 | $380 | $17,300 | $4,500 | $12,800 |
| 2021 | $462 | $21,700 | $6,700 | $15,000 |
| 2020 | $480 | $22,600 | $6,700 | $15,900 |
| 2019 | $486 | $22,900 | $6,400 | $16,500 |
| 2018 | $490 | $23,100 | $6,400 | $16,700 |
| 2017 | $484 | $22,800 | $5,500 | $17,300 |
| 2016 | $662 | $31,700 | $5,500 | $26,200 |
| 2014 | $574 | $28,700 | $4,000 | $24,700 |
| 2013 | $574 | $27,800 | $4,000 | $23,800 |
Source: Public Records
Map
Nearby Homes
- 0 W Deerfield Rd Unit 23016117
- 0 W Deerfield Rd Unit 837795
- 0 W Deerfield Rd
- 612 N Howard St
- 207 Allen Dr
- 1013 Caroline Ave
- 507 N Howard St
- 509 Indiana 28
- 508 N High St
- 722 N Union St
- 504 N Union St
- 504 N Union St Unit Street
- 543 N Walnut St
- 113 E North St
- 1210 W Hickory St
- 402 Charles St
- 1103 W Oak St
- 305 E North St
- 800 W Chestnut St
- 230 NW Deerfield Rd