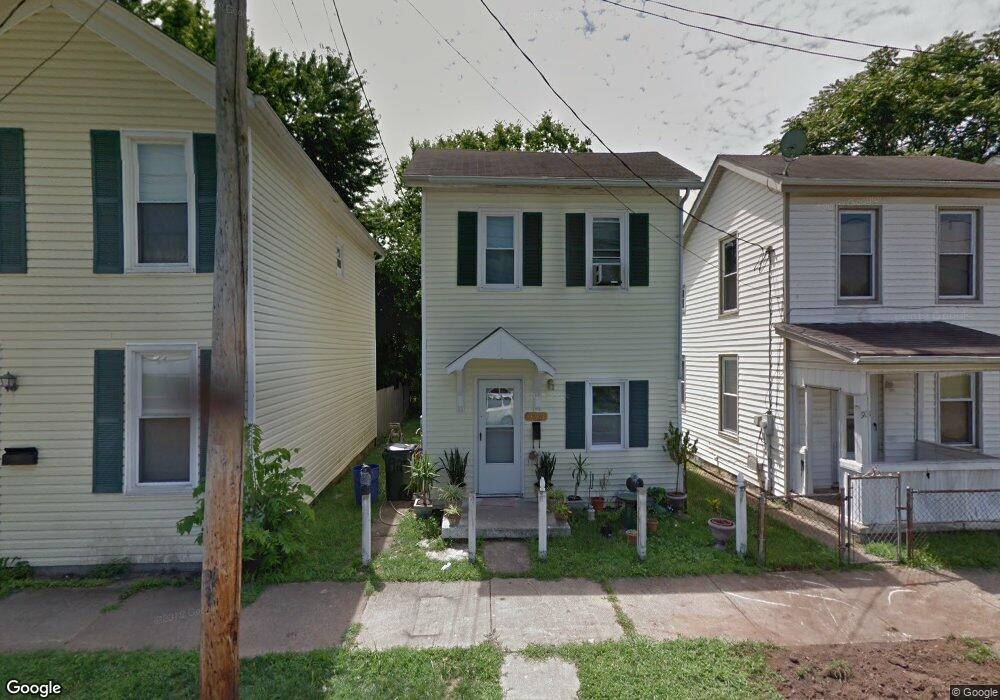
923 Reservoir St Hamilton, OH 45011
East Hamilton NeighborhoodEstimated Value: $107,598 - $132,000
2
Beds
1
Bath
810
Sq Ft
$144/Sq Ft
Est. Value
About This Home
This home is located at 923 Reservoir St, Hamilton, OH 45011 and is currently estimated at $116,900, approximately $144 per square foot. 923 Reservoir St is a home located in Butler County with nearby schools including Fairwood Elementary School, Garfield Middle School, and Hamilton Freshman School.
Ownership History
Date
Name
Owned For
Owner Type
Purchase Details
Closed on
May 27, 2022
Sold by
Canaan Deborah M
Bought by
Canaan Patrick J
Current Estimated Value
Purchase Details
Closed on
Apr 24, 2014
Sold by
Chitwood Adam and Chitwood Adam D
Bought by
Canaan Patrick J and Canaan Deborah
Purchase Details
Closed on
Dec 20, 2010
Sold by
Brown Bark I Lp
Bought by
Chitwood Adam
Purchase Details
Closed on
Jul 21, 2008
Sold by
Bowen Newt Darryl
Bought by
Brown Bark I Lp
Purchase Details
Closed on
Jan 20, 2005
Sold by
Bowen Newt Darryl and Bowen Lisa G
Bought by
Jpmj Holdings I Ltd
Home Financials for this Owner
Home Financials are based on the most recent Mortgage that was taken out on this home.
Original Mortgage
$36,000
Interest Rate
5.87%
Mortgage Type
Unknown
Purchase Details
Closed on
Apr 5, 1999
Sold by
Cornett Leo
Bought by
I M C Mtg Company
Purchase Details
Closed on
Mar 4, 1999
Sold by
Cornett Leo W
Bought by
Imc Mtg Company
Purchase Details
Closed on
Jan 1, 1989
Create a Home Valuation Report for This Property
The Home Valuation Report is an in-depth analysis detailing your home's value as well as a comparison with similar homes in the area
Home Values in the Area
Average Home Value in this Area
Purchase History
| Date | Buyer | Sale Price | Title Company |
|---|---|---|---|
| Canaan Patrick J | -- | Downing Patricia J | |
| Canaan Patrick J | -- | None Available | |
| Chitwood Adam | $4,000 | Attorney | |
| Brown Bark I Lp | $13,000 | None Available | |
| Jpmj Holdings I Ltd | -- | -- | |
| Bowen Newt Darryl | -- | -- | |
| I M C Mtg Company | $22,000 | -- | |
| Imc Mtg Company | -- | -- | |
| -- | $12,000 | -- |
Source: Public Records
Mortgage History
| Date | Status | Borrower | Loan Amount |
|---|---|---|---|
| Previous Owner | Bowen Newt Darryl | $36,000 |
Source: Public Records
Tax History Compared to Growth
Tax History
| Year | Tax Paid | Tax Assessment Tax Assessment Total Assessment is a certain percentage of the fair market value that is determined by local assessors to be the total taxable value of land and additions on the property. | Land | Improvement |
|---|---|---|---|---|
| 2024 | $919 | $20,260 | $1,800 | $18,460 |
| 2023 | $901 | $20,260 | $1,800 | $18,460 |
| 2022 | $860 | $16,180 | $1,800 | $14,380 |
| 2021 | $752 | $15,580 | $1,800 | $13,780 |
| 2020 | $782 | $15,580 | $1,800 | $13,780 |
| 2019 | $417 | $7,940 | $1,140 | $6,800 |
| 2018 | $407 | $7,940 | $1,140 | $6,800 |
| 2017 | $383 | $7,940 | $1,140 | $6,800 |
| 2016 | $426 | $7,880 | $1,140 | $6,740 |
| 2015 | $397 | $7,880 | $1,140 | $6,740 |
| 2014 | $1,215 | $12,490 | $1,800 | $10,690 |
| 2013 | $1,215 | $4,200 | $1,800 | $2,400 |
Source: Public Records
Map
Nearby Homes
- 808 Greenwood Ave
- 327 N 8th St
- 307 N 8th St
- 1217 Vine St
- 1019 Buckeye St
- 1017 Dayton St
- 330 Buckeye St
- 911 Campbell Ave
- 317 Buckeye St
- 21 N 7th St
- 1223 Campbell Ave
- 301 N Fair Ave
- 1327 Dayton St
- 5014 S Castle Ct
- 1327 Campbell Ave
- 1739 Morey Ave
- 1801 Morey Ave
- 603 Sycamore St
- 1114 Chestnut St
- 1232 Chestnut St