923 S 7th St Goshen, IN 46526
Parkside NeighborhoodEstimated Value: $170,000 - $208,000
3
Beds
1
Bath
2,066
Sq Ft
$95/Sq Ft
Est. Value
About This Home
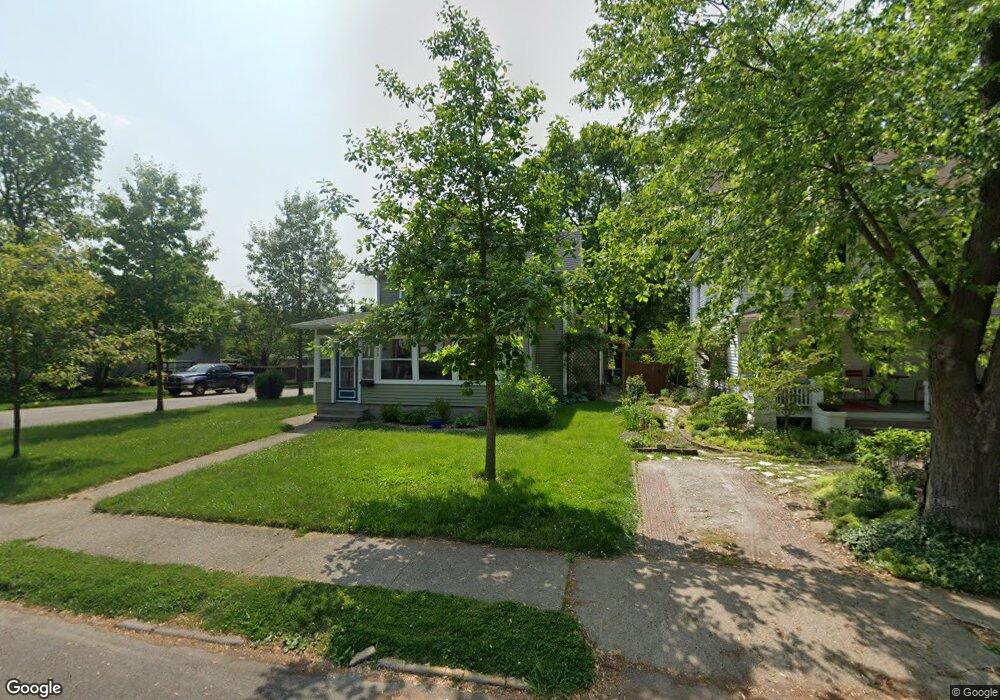
This home is located at 923 S 7th St, Goshen, IN 46526 and is currently estimated at $195,810, approximately $94 per square foot. 923 S 7th St is a home located in Elkhart County with nearby schools including Parkside Elementary School, Goshen Jr. High School, and Goshen High School.
Ownership History
Date
Name
Owned For
Owner Type
Purchase Details
Closed on
Jan 23, 2020
Sold by
Peter Gilbert
Bought by
Bontrager-Singer Llc
Current Estimated Value
Purchase Details
Closed on
Apr 8, 2008
Sold by
Kruger Paul J
Bought by
Gilbert Peter
Home Financials for this Owner
Home Financials are based on the most recent Mortgage that was taken out on this home.
Original Mortgage
$64,800
Interest Rate
6.32%
Mortgage Type
Purchase Money Mortgage
Create a Home Valuation Report for This Property
The Home Valuation Report is an in-depth analysis detailing your home's value as well as a comparison with similar homes in the area
Home Values in the Area
Average Home Value in this Area
Purchase History
| Date | Buyer | Sale Price | Title Company |
|---|---|---|---|
| Bontrager-Singer Llc | -- | None Listed On Document | |
| Gilbert Peter | -- | None Available |
Source: Public Records
Mortgage History
| Date | Status | Borrower | Loan Amount |
|---|---|---|---|
| Previous Owner | Gilbert Peter | $64,800 |
Source: Public Records
Tax History
| Year | Tax Paid | Tax Assessment Tax Assessment Total Assessment is a certain percentage of the fair market value that is determined by local assessors to be the total taxable value of land and additions on the property. | Land | Improvement |
|---|---|---|---|---|
| 2025 | $4,392 | $177,900 | $21,700 | $156,200 |
| 2024 | $4,392 | $175,100 | $21,700 | $153,400 |
| 2022 | $2,201 | $87,900 | $0 | $87,900 |
| 2021 | $1,835 | $76,400 | $0 | $76,400 |
| 2020 | $3,236 | $120,100 | $21,700 | $98,400 |
| 2019 | $2,745 | $110,700 | $21,700 | $89,000 |
| 2018 | $2,468 | $105,000 | $21,700 | $83,300 |
| 2017 | $1,037 | $101,000 | $21,700 | $79,300 |
| 2016 | $1,006 | $95,900 | $21,700 | $74,200 |
| 2014 | $886 | $87,000 | $21,700 | $65,300 |
| 2013 | $895 | $89,500 | $21,700 | $67,800 |
Source: Public Records
Map
Nearby Homes
- 811 S 6th St
- 1303 Wilson Ave
- 628 S 6th St
- 1323 S 8th St
- 1415 S Main St
- 1002 S 13th St
- 905 S 14th St
- 308 E Madison St
- 1613 S 10th St
- 311 S 7th St
- 1405 Pembroke Cir
- 1601 S 16th St Unit 11
- 1409 Pembroke Cir Unit 6
- 1324 E Douglas St
- 60867 Indiana 15
- 1408 Kentfield Way
- 1521 Kentfield Way Unit 4
- 615 Mercer Ave
- 415 Cross St
- 64468 Meadow Ridge Dr
Your Personal Tour Guide
Ask me questions while you tour the home.