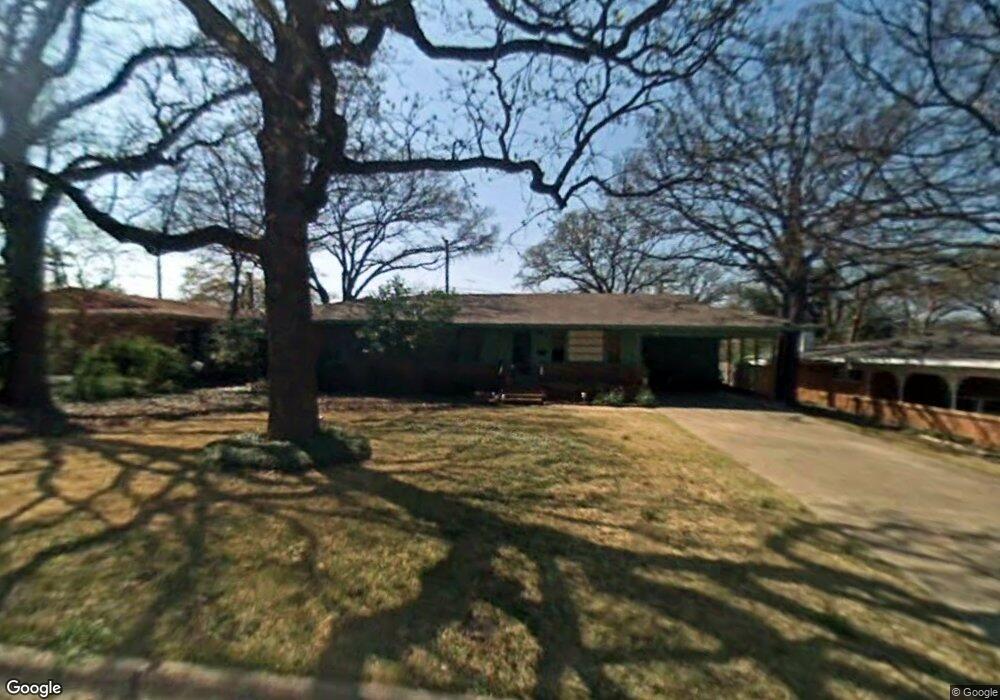
923 S French Ave Denison, TX 75020
Estimated Value: $188,987 - $289,000
3
Beds
2
Baths
1,466
Sq Ft
$163/Sq Ft
Est. Value
About This Home
This home is located at 923 S French Ave, Denison, TX 75020 and is currently estimated at $238,994, approximately $163 per square foot. 923 S French Ave is a home located in Grayson County with nearby schools including Houston Elementary School, Scott Middle School, and Denison High School.
Ownership History
Date
Name
Owned For
Owner Type
Purchase Details
Closed on
Jun 7, 2013
Sold by
Secretary Of Hud
Bought by
Williams Enid Anne
Current Estimated Value
Purchase Details
Closed on
Feb 26, 2013
Sold by
Jpmorgan Chase Bank
Bought by
Secretary Of Hud
Purchase Details
Closed on
Feb 5, 2013
Sold by
Minyard Glenda B and Minyard Wayne R
Bought by
Jpmoragan Chase Bank Na
Purchase Details
Closed on
Oct 25, 2006
Sold by
Freeman Charles D and Freemen Louise A
Bought by
Minyard Wayne R and Minyard Glenda B
Home Financials for this Owner
Home Financials are based on the most recent Mortgage that was taken out on this home.
Original Mortgage
$94,812
Interest Rate
6.37%
Mortgage Type
Purchase Money Mortgage
Create a Home Valuation Report for This Property
The Home Valuation Report is an in-depth analysis detailing your home's value as well as a comparison with similar homes in the area
Home Values in the Area
Average Home Value in this Area
Purchase History
| Date | Buyer | Sale Price | Title Company |
|---|---|---|---|
| Williams Enid Anne | -- | None Available | |
| Secretary Of Hud | -- | None Available | |
| Jpmoragan Chase Bank Na | $120,236 | None Available | |
| Minyard Wayne R | -- | Chapin Title Co Inc |
Source: Public Records
Mortgage History
| Date | Status | Borrower | Loan Amount |
|---|---|---|---|
| Previous Owner | Minyard Wayne R | $94,812 |
Source: Public Records
Tax History Compared to Growth
Tax History
| Year | Tax Paid | Tax Assessment Tax Assessment Total Assessment is a certain percentage of the fair market value that is determined by local assessors to be the total taxable value of land and additions on the property. | Land | Improvement |
|---|---|---|---|---|
| 2025 | $755 | $169,896 | $41,527 | $128,369 |
| 2024 | $3,702 | $159,330 | $0 | $0 |
| 2023 | $755 | $144,845 | $0 | $0 |
| 2022 | $3,129 | $131,677 | $0 | $0 |
| 2021 | $3,019 | $119,706 | $17,417 | $102,289 |
| 2020 | $3,033 | $114,970 | $17,417 | $97,553 |
| 2019 | $2,916 | $113,068 | $17,417 | $95,651 |
| 2018 | $2,673 | $103,940 | $14,243 | $89,697 |
| 2017 | $2,451 | $91,026 | $11,240 | $79,786 |
| 2016 | $2,228 | $87,716 | $11,247 | $76,469 |
| 2015 | $1,190 | $72,392 | $11,247 | $61,145 |
| 2014 | $1,452 | $76,514 | $11,247 | $65,267 |
Source: Public Records
Map
Nearby Homes
- 1730 W Hull St
- 901 Old State Ln
- 1508 W Shepherd St
- 12 Ambassador Ct
- 1510 W Heron St
- 612 Ambassador St
- 1315 W Hull St
- 600 Ambassador St
- 931 Waterloo Lake Dr
- 901 Waterloo Lake Dr
- 1224 W Nelson St
- 501 S Eddy Ave
- 1319 W Morgan St
- TBD W Crawford St
- 1217 W Nelson St
- 1731 W Crawford St
- 1131 W Shepherd St
- 2105 W Crawford St
- 1326 W Crawford St
- 0 S Maurice Ave
- 919 S French Ave
- 931 S French Ave
- 1727 W Hull St
- 911 S French Ave
- 918 S French Ave
- 930 S French Ave
- 1503 S French Ave
- 1731 W Hull St
- 910 S French Ave
- 1700 W Hull St
- 907 S French Ave
- 906 S French Ave
- 1010 S Derby St
- 1800 W Hull St
- 1011 S French Ave
- 905 S French Ave
- 1803 W Hull St
- 1630 W Hull St
- 1630 W Munson St
- 1801 W Munson St