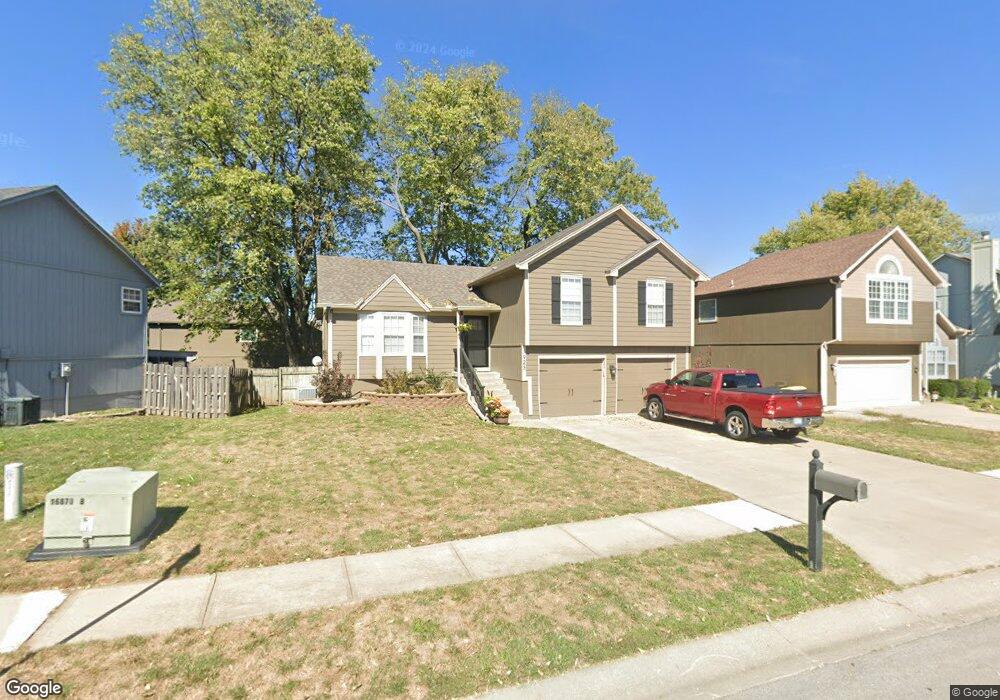
923 SW Bishop Dr Blue Springs, MO 64015
Estimated Value: $320,000 - $404,000
3
Beds
3
Baths
1,984
Sq Ft
$182/Sq Ft
Est. Value
About This Home
This home is located at 923 SW Bishop Dr, Blue Springs, MO 64015 and is currently estimated at $362,022, approximately $182 per square foot. 923 SW Bishop Dr is a home located in Jackson County with nearby schools including Cordill-Mason Elementary School, Moreland Ridge Middle School, and Blue Springs South High School.
Ownership History
Date
Name
Owned For
Owner Type
Purchase Details
Closed on
Dec 14, 2005
Sold by
M & M Properties Inc
Bought by
Bradley Michael J and Bradley Penelope L
Current Estimated Value
Home Financials for this Owner
Home Financials are based on the most recent Mortgage that was taken out on this home.
Original Mortgage
$129,100
Outstanding Balance
$72,232
Interest Rate
6.29%
Mortgage Type
New Conventional
Estimated Equity
$289,790
Purchase Details
Closed on
Aug 18, 1997
Sold by
Miller Enterprises Inc
Bought by
Bahamundi Milton and Bahamundi Iris M
Home Financials for this Owner
Home Financials are based on the most recent Mortgage that was taken out on this home.
Original Mortgage
$102,350
Interest Rate
7.47%
Mortgage Type
Purchase Money Mortgage
Create a Home Valuation Report for This Property
The Home Valuation Report is an in-depth analysis detailing your home's value as well as a comparison with similar homes in the area
Home Values in the Area
Average Home Value in this Area
Purchase History
| Date | Buyer | Sale Price | Title Company |
|---|---|---|---|
| Bradley Michael J | -- | Stewart Title Of Kansas City | |
| Bahamundi Milton | -- | Security Land Title Company |
Source: Public Records
Mortgage History
| Date | Status | Borrower | Loan Amount |
|---|---|---|---|
| Open | Bradley Michael J | $129,100 | |
| Previous Owner | Bahamundi Milton | $102,350 | |
| Closed | Bahamundi Milton | $27,300 |
Source: Public Records
Tax History Compared to Growth
Tax History
| Year | Tax Paid | Tax Assessment Tax Assessment Total Assessment is a certain percentage of the fair market value that is determined by local assessors to be the total taxable value of land and additions on the property. | Land | Improvement |
|---|---|---|---|---|
| 2025 | $4,345 | $54,023 | $7,511 | $46,512 |
| 2024 | $4,261 | $53,253 | $3,791 | $49,462 |
| 2023 | $4,261 | $53,253 | $4,877 | $48,376 |
| 2022 | $3,698 | $40,850 | $4,294 | $36,556 |
| 2021 | $3,695 | $40,850 | $4,294 | $36,556 |
| 2020 | $3,165 | $35,589 | $4,294 | $31,295 |
| 2019 | $3,060 | $35,589 | $4,294 | $31,295 |
| 2018 | $2,923 | $32,730 | $4,105 | $28,625 |
| 2017 | $2,923 | $32,730 | $4,105 | $28,625 |
| 2016 | $2,813 | $31,578 | $5,681 | $25,897 |
| 2014 | $2,714 | $30,362 | $5,674 | $24,688 |
Source: Public Records
Map
Nearby Homes
- 3205 SW 8th St
- 3311 SW Meyer Blvd
- 3608 SW 10th Street Ct
- 2807 SW Summer Creek Ct
- 3605 SW Meyer Blvd
- 3908 SW 9th St
- 4000 SW 9th St
- 2603 SW Shadow Creek Ct
- 309 SW Moreland School Rd
- 404 SW Shamrock Place
- 3101 S 1 St
- 1103 SW Stonecreek Dr
- 3400 SW 22nd St
- 104 SE Sherri Ln
- 2413 SW Emerald Creek Place
- 2257 SW Wall St
- 2253 SW Wall St
- 208 SE Mount Vernon Dr
- 2115 S 7 Hwy
- 1205 SW Southgate Dr
- 919 SW Bishop Dr
- 927 SW Bishop Dr
- 3208 SW 10th Terrace
- 915 SW Bishop Dr
- 3204 SW 10th Terrace
- 911 SW Bishop Dr
- 3213 SW 10th Terrace
- 3217 SW 10th Terrace
- 3200 SW 10th Terrace
- 3209 SW 10th Terrace
- 907 SW Bishop Dr
- 828 SW Bishop Ct
- 832 SW Bishop Ct
- 3201 SW 10th Terrace
- 903 SW Bishop Dr
- 3205 SW 10th Terrace
- 3220 SW 11th Street Cir
- 833 SW Bishop Ct
- 3216 SW 11th Street Cir
- 827 SW Bishop Dr