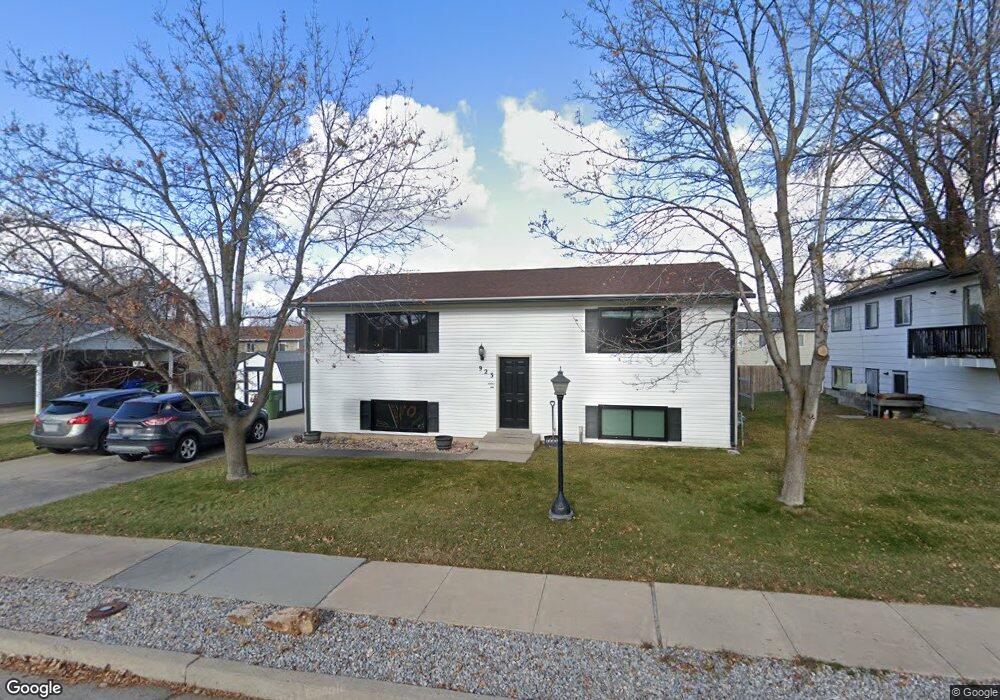
923 Three Point Ave Logan, UT 84321
Woodruff NeighborhoodEstimated Value: $345,000 - $405,000
4
Beds
2
Baths
1,960
Sq Ft
$190/Sq Ft
Est. Value
About This Home
This home is located at 923 Three Point Ave, Logan, UT 84321 and is currently estimated at $372,729, approximately $190 per square foot. 923 Three Point Ave is a home located in Cache County with nearby schools including Woodruff School, Mount Logan Middle School, and Logan High School.
Ownership History
Date
Name
Owned For
Owner Type
Purchase Details
Closed on
Jan 12, 2026
Sold by
Lane Michael T and Lane Samuel R
Bought by
Lane Samuel R and Lane Michael T
Current Estimated Value
Home Financials for this Owner
Home Financials are based on the most recent Mortgage that was taken out on this home.
Original Mortgage
$370,644
Outstanding Balance
$370,288
Interest Rate
6.19%
Mortgage Type
FHA
Estimated Equity
$2,441
Purchase Details
Closed on
Mar 10, 2023
Sold by
Jensen Steven L
Bought by
Lane Michael T and Lane Samuel R
Home Financials for this Owner
Home Financials are based on the most recent Mortgage that was taken out on this home.
Original Mortgage
$348,570
Interest Rate
6.6%
Mortgage Type
FHA
Create a Home Valuation Report for This Property
The Home Valuation Report is an in-depth analysis detailing your home's value as well as a comparison with similar homes in the area
Home Values in the Area
Average Home Value in this Area
Purchase History
| Date | Buyer | Sale Price | Title Company |
|---|---|---|---|
| Lane Samuel R | -- | Us Title | |
| Lane Michael T | -- | Hickman Land Title |
Source: Public Records
Mortgage History
| Date | Status | Borrower | Loan Amount |
|---|---|---|---|
| Open | Lane Samuel R | $370,644 | |
| Previous Owner | Lane Michael T | $348,570 | |
| Previous Owner | Lane Michael T | $19,485 |
Source: Public Records
Tax History
| Year | Tax Paid | Tax Assessment Tax Assessment Total Assessment is a certain percentage of the fair market value that is determined by local assessors to be the total taxable value of land and additions on the property. | Land | Improvement |
|---|---|---|---|---|
| 2025 | $1,301 | $168,290 | $0 | $0 |
| 2024 | $1,307 | $163,730 | $0 | $0 |
| 2023 | $1,348 | $160,895 | $0 | $0 |
| 2022 | $1,443 | $160,895 | $0 | $0 |
| 2021 | $136 | $234,720 | $42,000 | $192,720 |
| 2020 | $1,307 | $202,600 | $42,000 | $160,600 |
| 2019 | $1,168 | $173,234 | $42,000 | $131,234 |
| 2018 | $1,087 | $147,216 | $36,000 | $111,216 |
| 2017 | $1,039 | $74,415 | $0 | $0 |
| 2016 | $1,078 | $74,415 | $0 | $0 |
| 2015 | $1,079 | $74,415 | $0 | $0 |
| 2014 | $852 | $65,020 | $0 | $0 |
| 2013 | -- | $66,010 | $0 | $0 |
Source: Public Records
Map
Nearby Homes
- 952 W 330 S
- 1400 S 940 W
- 1031 W 350 S
- 207 Sunstone Cir
- 501 Southwest St
- 1099 Three Pointe Ave
- 553 Center Ave
- 370 S 1200 W Unit 2
- 508 S 1215 W Unit 144
- 539 S 1215 W Unit 129
- 551 S 1215 W Unit 131
- 1214 W 575 S
- 1204 W 575 S
- 1210 W 575 S Unit 163
- 1210 W 575 S
- 562 S 1215 W Unit 135
- 1239 W 575 S
- 245 S 1280 W
- 226 S 600 W
- 1615 Silver Canoe Way
- 911 Three Point Ave
- 935 Three Point Ave
- 916 Knowles Ln
- 904 Knowles Ln
- 932 Knowles Ln
- 947 Three Point Ave
- 940 Knowles Ln
- 923 Knowles Ln
- 915 Knowles Ln
- 895 Three Point Ave
- 866 Three Pointe Ave
- 1199 Three Pointe Ave Unit 31
- 959 Three Pointe Ave
- 931 Knowles Ln
- 420 Knowles Ln
- 952 Knowles Ln
- 905 Knowles Ln
- 890 Three Point Ave
- 943 Knowles Ln
- 398 Knowles Ln
Your Personal Tour Guide
Ask me questions while you tour the home.