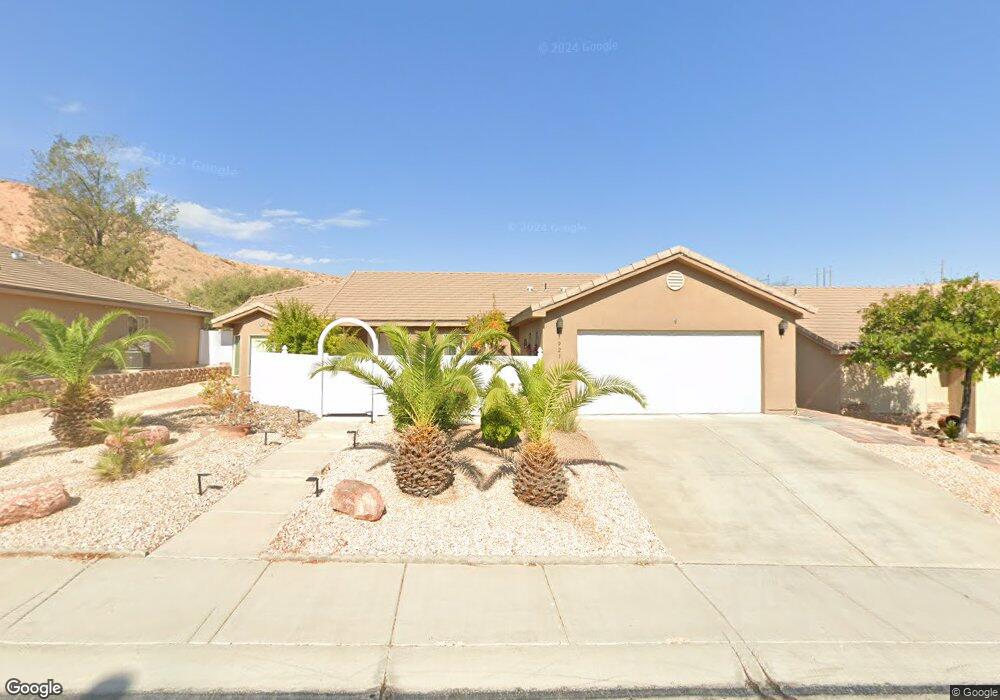
923 Turtle Cove Mesquite, NV 89027
Estimated Value: $411,150 - $441,000
3
Beds
2
Baths
1,686
Sq Ft
$254/Sq Ft
Est. Value
About This Home
This home is located at 923 Turtle Cove, Mesquite, NV 89027 and is currently estimated at $428,788, approximately $254 per square foot. 923 Turtle Cove is a home located in Clark County with nearby schools including Virgin Valley Elementary School, Charles Arthur Hughes Middle School, and Virgin Valley High School.
Ownership History
Date
Name
Owned For
Owner Type
Purchase Details
Closed on
Jul 19, 2021
Sold by
Siebeneicher Carol Jane and Siebeneicher Family Trust
Bought by
Peebles Samuel B and Peebles Norine H
Current Estimated Value
Home Financials for this Owner
Home Financials are based on the most recent Mortgage that was taken out on this home.
Original Mortgage
$254,000
Outstanding Balance
$230,677
Interest Rate
2.96%
Mortgage Type
New Conventional
Estimated Equity
$198,111
Purchase Details
Closed on
May 17, 2019
Sold by
Seibeneicher Adolph E
Bought by
Siebeneicher Family Trust
Purchase Details
Closed on
Jun 20, 2005
Sold by
Ford Virginia Ann Alex
Bought by
Siebeneicher Adolph E
Purchase Details
Closed on
Apr 8, 2005
Sold by
Primex Properties Ltd
Bought by
Ford Virginia Ann Alex and The Virginia Ann Alex Ford Trust
Purchase Details
Closed on
Jan 3, 2005
Sold by
Primex Plastics Corp
Bought by
Primex Properties Ltd
Create a Home Valuation Report for This Property
The Home Valuation Report is an in-depth analysis detailing your home's value as well as a comparison with similar homes in the area
Home Values in the Area
Average Home Value in this Area
Purchase History
| Date | Buyer | Sale Price | Title Company |
|---|---|---|---|
| Peebles Samuel B | $349,000 | Stewart Title Company Fo | |
| Siebeneicher Family Trust | -- | None Available | |
| Siebeneicher Adolph E | $280,000 | Equity Title Of Nevada | |
| Siebeneicher Adolph E | $280,000 | Equity Title Of Nevada | |
| Ford Virginia Ann Alex | $202,850 | Equity Title Of Nevada | |
| Primex Properties Ltd | -- | Equity Title Of Nevada |
Source: Public Records
Mortgage History
| Date | Status | Borrower | Loan Amount |
|---|---|---|---|
| Open | Peebles Samuel B | $254,000 |
Source: Public Records
Tax History Compared to Growth
Tax History
| Year | Tax Paid | Tax Assessment Tax Assessment Total Assessment is a certain percentage of the fair market value that is determined by local assessors to be the total taxable value of land and additions on the property. | Land | Improvement |
|---|---|---|---|---|
| 2025 | $2,108 | $125,761 | $37,800 | $87,961 |
| 2024 | $2,047 | $125,761 | $37,800 | $87,961 |
| 2023 | $1,669 | $111,012 | $28,000 | $83,012 |
| 2022 | $1,988 | $100,717 | $25,200 | $75,517 |
| 2021 | $1,930 | $92,775 | $21,000 | $71,775 |
| 2020 | $1,872 | $88,395 | $21,000 | $67,395 |
| 2019 | $1,817 | $87,149 | $21,000 | $66,149 |
| 2018 | $1,764 | $79,358 | $17,500 | $61,858 |
| 2017 | $2,109 | $76,044 | $16,100 | $59,944 |
| 2016 | $1,669 | $68,233 | $13,650 | $54,583 |
| 2015 | $1,666 | $62,183 | $10,500 | $51,683 |
| 2014 | $1,614 | $56,512 | $8,750 | $47,762 |
Source: Public Records
Map
Nearby Homes
- 957 Diamond Cir
- 565 Desert Tortoise Way
- 490 Ruby Dr
- 744 Pinnacle Ct
- Gardengate Plan at Suntero
- Parklane Plan at Suntero
- Trieste Plan at Suntero
- 518 Plateau Rd
- 1180 Mesa Verde Run
- 334 Colleen Ct Unit D
- 730 Hardy Way Unit A
- 1348 Mariposa Way
- 1222 Blind Pew Ridge
- Residence 2188 Plan at Montrose at Canyon Crest
- Residence 1974 Plan at Montrose at Canyon Crest
- Residence 1833 Plan at Montrose at Canyon Crest
- Residence 1729 Plan at Montrose at Canyon Crest
- Residence 1502 Plan at Montrose at Canyon Crest
- 641 Hardy Way
- 433 Canyon Dr
- 939 Turtle Cove
- 907 Turtle Cove
- 534 Desert Tortoise Way
- 899 Turtle Cove
- 955 Turtle Cove
- 544 Desert Tortoise Way
- 914 Turtle Cove
- 891 Turtle Cove
- 898 Turtle Cove
- 554 Desert Tortoise Way
- 966 Turtle Cove
- 883 Turtle Cove
- 890 Turtle Cove
- 525 Desert Tortoise Way
- 515 Desert Tortoise Way
- 535 Desert Tortoise Way
- 564 Desert Tortoise Way
- 545 Desert Tortoise Way
- 882 Turtle Cove
- 499 Palm Cove Ct