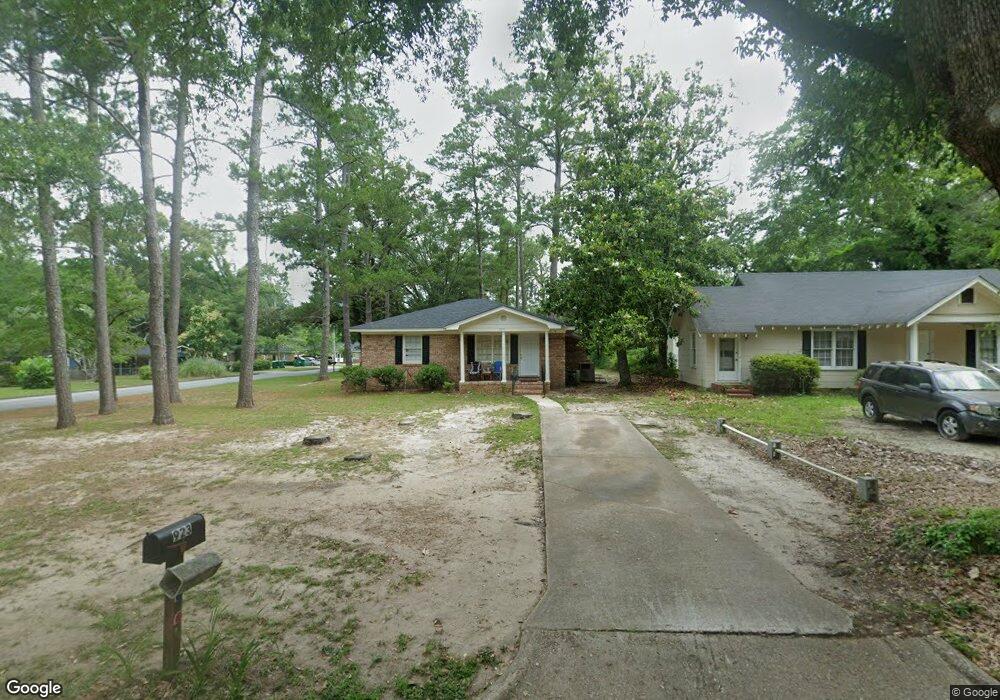
923 W 4th Ave Albany, GA 31701
Rawson Park NeighborhoodEstimated Value: $156,000 - $198,000
4
Beds
2
Baths
2,016
Sq Ft
$84/Sq Ft
Est. Value
About This Home
This home is located at 923 W 4th Ave, Albany, GA 31701 and is currently estimated at $169,820, approximately $84 per square foot. 923 W 4th Ave is a home located in Dougherty County with nearby schools including Northside Elementary School, Albany Middle School, and Albany High School.
Ownership History
Date
Name
Owned For
Owner Type
Purchase Details
Closed on
Feb 4, 2016
Sold by
Willingham Myra T
Bought by
Meme9 Properties Llc
Current Estimated Value
Purchase Details
Closed on
May 1, 2000
Sold by
Turner Roy H Indiv & As Ex & Trustee U/W
Bought by
R H Turner Properties Lllp
Purchase Details
Closed on
Jan 15, 1998
Sold by
Fields Richard W and Gonnerman Mark A
Bought by
Turner Roy H
Purchase Details
Closed on
Jan 21, 1988
Sold by
Brooks William
Bought by
Fields Fields and Fields Gonnerman
Create a Home Valuation Report for This Property
The Home Valuation Report is an in-depth analysis detailing your home's value as well as a comparison with similar homes in the area
Home Values in the Area
Average Home Value in this Area
Purchase History
| Date | Buyer | Sale Price | Title Company |
|---|---|---|---|
| Meme9 Properties Llc | $160,000 | -- | |
| Willingham Myra T | -- | -- | |
| R H Turner Properties Lllp | -- | -- | |
| Turner Roy H | $68,000 | -- | |
| Fields Fields | -- | -- |
Source: Public Records
Tax History Compared to Growth
Tax History
| Year | Tax Paid | Tax Assessment Tax Assessment Total Assessment is a certain percentage of the fair market value that is determined by local assessors to be the total taxable value of land and additions on the property. | Land | Improvement |
|---|---|---|---|---|
| 2024 | $1,775 | $37,196 | $6,480 | $30,716 |
| 2023 | $1,733 | $37,196 | $6,480 | $30,716 |
| 2022 | $1,739 | $37,196 | $6,480 | $30,716 |
| 2021 | $1,613 | $37,196 | $6,480 | $30,716 |
| 2020 | $1,616 | $37,196 | $6,480 | $30,716 |
| 2019 | $1,623 | $37,196 | $6,480 | $30,716 |
| 2018 | $1,629 | $37,196 | $6,480 | $30,716 |
| 2017 | $1,289 | $37,196 | $6,480 | $30,716 |
| 2016 | $1,519 | $37,196 | $6,480 | $30,716 |
| 2015 | $1,523 | $37,196 | $6,480 | $30,716 |
| 2014 | $1,504 | $37,196 | $6,480 | $30,716 |
Source: Public Records
Map
Nearby Homes