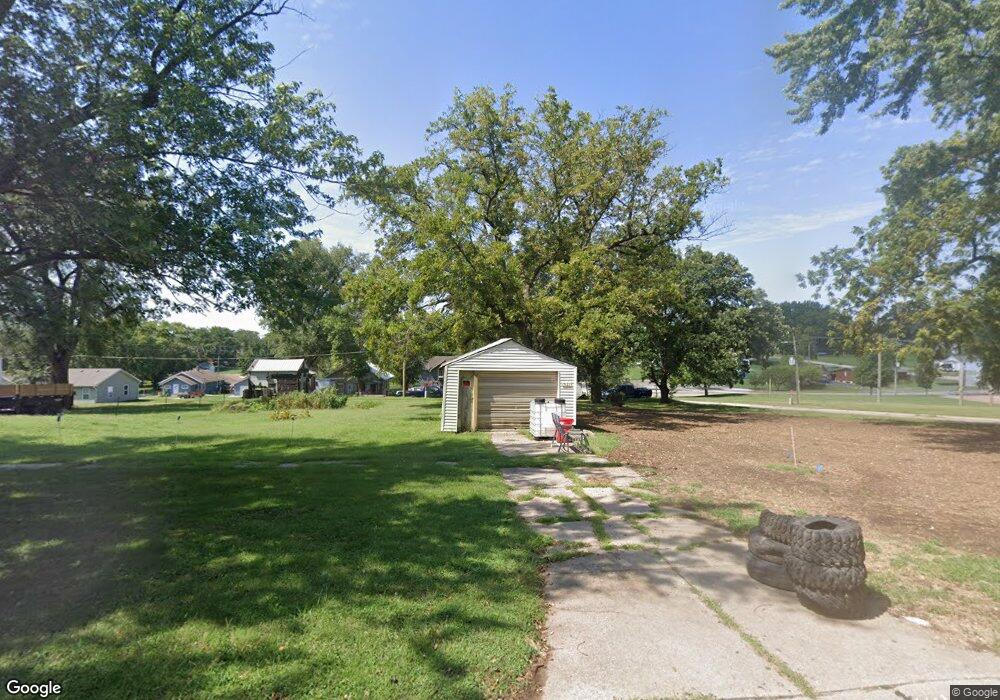
923 Wilson St Falls City, NE 68355
Estimated Value: $52,549 - $63,000
1
Bed
1
Bath
688
Sq Ft
$84/Sq Ft
Est. Value
About This Home
This home is located at 923 Wilson St, Falls City, NE 68355 and is currently estimated at $57,887, approximately $84 per square foot. 923 Wilson St is a home located in Richardson County with nearby schools including Falls City North Elementary School, Falls City South Elementary School, and Falls City Middle School.
Ownership History
Date
Name
Owned For
Owner Type
Purchase Details
Closed on
Apr 4, 2011
Sold by
Fryer Keith
Bought by
Fryer Keith and Orr Ashley
Current Estimated Value
Purchase Details
Closed on
Mar 9, 2007
Sold by
Pethoud Marvin K and Pethoud Virginia
Bought by
Fryer Keith and Fryer Jerald
Purchase Details
Closed on
Feb 28, 2007
Sold by
Pethoud Marvin K and Pethoud Virginia A
Bought by
Fryer Keith and Gryer Jerald
Purchase Details
Closed on
Jun 24, 2004
Sold by
Koso Bennie O and Koso Anneliese I
Bought by
Pethoud Marvin K and Pethoud Virginia
Create a Home Valuation Report for This Property
The Home Valuation Report is an in-depth analysis detailing your home's value as well as a comparison with similar homes in the area
Home Values in the Area
Average Home Value in this Area
Purchase History
| Date | Buyer | Sale Price | Title Company |
|---|---|---|---|
| Fryer Keith | -- | -- | |
| Fryer Keith | $5,000 | -- | |
| Fryer Keith | $5,000 | -- | |
| Pethoud Marvin K | $6,000 | -- |
Source: Public Records
Tax History Compared to Growth
Tax History
| Year | Tax Paid | Tax Assessment Tax Assessment Total Assessment is a certain percentage of the fair market value that is determined by local assessors to be the total taxable value of land and additions on the property. | Land | Improvement |
|---|---|---|---|---|
| 2025 | $60 | $6,419 | $4,500 | $1,919 |
| 2024 | $60 | $6,310 | $4,500 | $1,810 |
| 2023 | $214 | $13,029 | $4,500 | $8,529 |
| 2022 | $251 | $13,090 | $4,860 | $8,230 |
| 2021 | $250 | $13,323 | $4,860 | $8,463 |
| 2020 | $201 | $10,615 | $3,240 | $7,375 |
| 2019 | $200 | $10,400 | $3,240 | $7,160 |
| 2018 | $198 | $10,191 | $3,240 | $6,951 |
| 2017 | $198 | $10,191 | $3,240 | $6,951 |
| 2016 | $193 | $9,989 | $3,240 | $6,749 |
| 2015 | $194 | $9,989 | $3,240 | $6,749 |
| 2014 | $194 | $9,989 | $3,240 | $6,749 |
Source: Public Records
Map
Nearby Homes