9230 Horseshoe Basin Ave Las Vegas, NV 89149
Centennial Hills Town Center NeighborhoodEstimated payment $2,533/month
Highlights
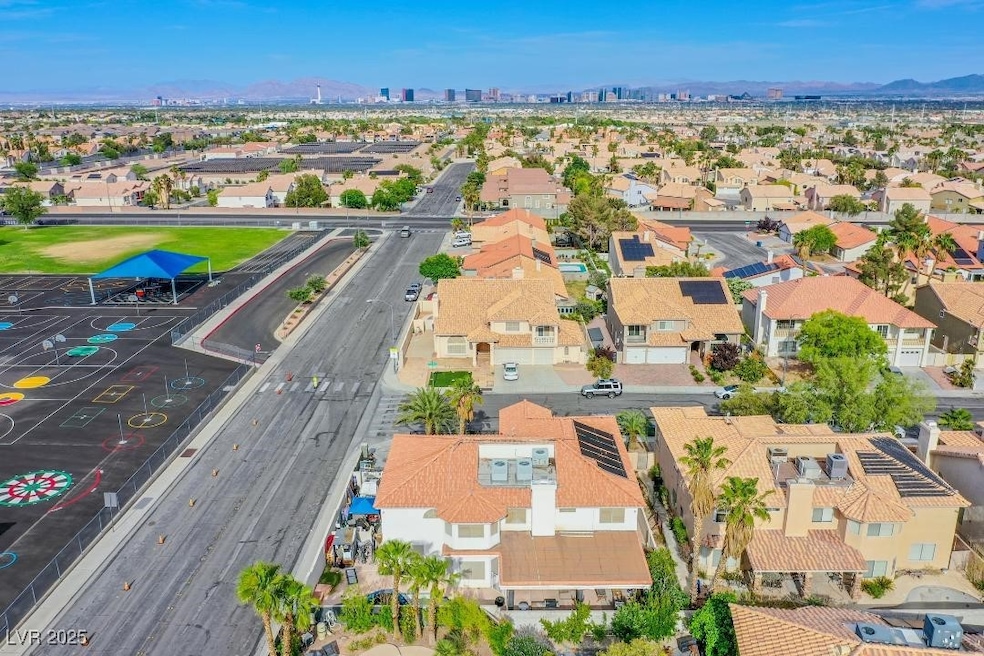
- Mountain View
- Refrigerated Cooling System
- Parking Storage or Cabinetry
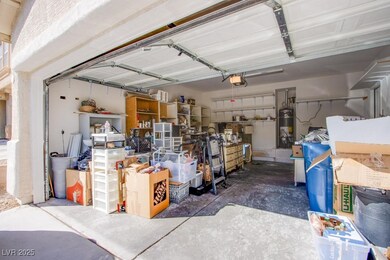
- 2 Car Attached Garage
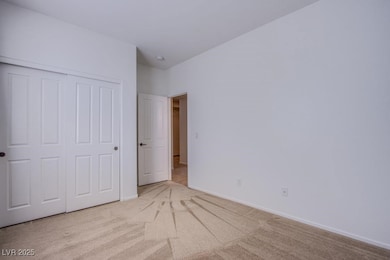
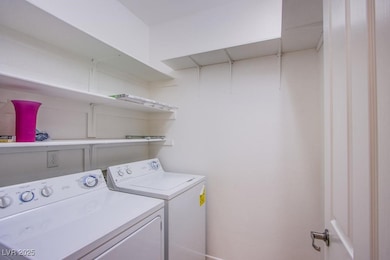
- Laundry Room
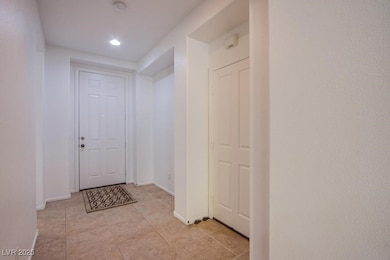
- Ceramic Tile Flooring
About This Home
OPEN HOUSE THIS FRIDAY, NOVEMBER 21ST--- 1:00--4:00 --- SATURDAY, NOVEMBER 22ND -- 12:00--3:00------Charming 1 story home in northwest----well loved & well kept home !! ----just a great location for schools---shopping ---freeway 95 & 215 are minutes away --3-bed--2 bath--2 car- Island kitchen featuring new farmers sink---2 pantries--brick patio out back --fruit trees --Fig --Apricot--Pomegranate -- back yard has access from both sides of home -- tall block wall surrounds the back yard ! lots of shelving in the garage--this is a nice home, come take a peek !
Listing Agent
Realty ONE Group, Inc Brokerage Email: gwgroper@aol.com License #S.0036120 Listed on: 10/02/2025

Home Details
Home Type
- Single Family
Est. Annual Taxes
- $2,530
Year Built
- Built in 2005
Lot Details
- 4,792 Sq Ft Lot
- South Facing Home
- Block Wall Fence
- Drip System Landscaping
- Back Yard Fenced
HOA Fees
- $57 Monthly HOA Fees
Parking
- 2 Car Attached Garage
- Parking Storage or Cabinetry
- Inside Entrance
- Garage Door Opener
Home Design
- Frame Construction
- Tile Roof
- Stucco
Interior Spaces
- 1,592 Sq Ft Home
- 1-Story Property
- Ceiling Fan
- Gas Fireplace
- Blinds
- Family Room with Fireplace
- Mountain Views
Kitchen
- Built-In Gas Oven
- Gas Cooktop
- Microwave
- Disposal
Flooring
- Carpet
- Laminate
- Ceramic Tile
Bedrooms and Bathrooms
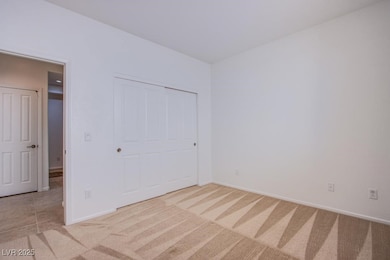
- 3 Bedrooms
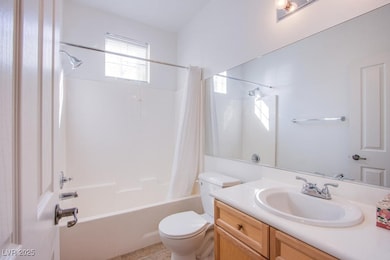
- 2 Full Bathrooms
Laundry
- Laundry Room
- Dryer
- Washer
Eco-Friendly Details
- Sprinkler System
Schools
- Darnell Elementary School
- Escobedo Edmundo Middle School
- Centennial High School
Utilities
- Refrigerated Cooling System
- Central Heating and Cooling System
- Heating System Uses Gas
- Cable TV Available
Community Details
- Association fees include ground maintenance
- Town Center Village Association, Phone Number (702) 767-9993
- Town Center Assemblage L Tc 55 #2 Subdivision
Map
Home Values in the Area
Average Home Value in this Area
Tax History
| Year | Tax Paid | Tax Assessment Tax Assessment Total Assessment is a certain percentage of the fair market value that is determined by local assessors to be the total taxable value of land and additions on the property. | Land | Improvement |
|---|---|---|---|---|
| 2025 | $2,530 | $110,397 | $33,950 | $76,447 |
| 2024 | $2,343 | $110,397 | $33,950 | $76,447 |
| 2023 | $1,560 | $107,847 | $35,700 | $72,147 |
| 2022 | $2,170 | $97,079 | $31,150 | $65,929 |
| 2021 | $2,010 | $90,089 | $27,650 | $62,439 |
| 2020 | $1,863 | $87,736 | $25,900 | $61,836 |
| 2019 | $1,746 | $84,469 | $23,800 | $60,669 |
| 2018 | $1,666 | $78,449 | $19,950 | $58,499 |
| 2017 | $2,303 | $70,239 | $15,750 | $54,489 |
| 2016 | $1,560 | $62,726 | $15,050 | $47,676 |
| 2015 | $1,556 | $52,135 | $11,550 | $40,585 |
| 2014 | $1,508 | $44,635 | $8,750 | $35,885 |
Property History
| Date | Event | Price | List to Sale | Price per Sq Ft |
|---|---|---|---|---|
| 11/12/2025 11/12/25 | Price Changed | $429,000 | -4.5% | $269 / Sq Ft |
| 10/02/2025 10/02/25 | For Sale | $449,000 | -- | $282 / Sq Ft |
Purchase History
| Date | Type | Sale Price | Title Company |
|---|---|---|---|
| Bargain Sale Deed | $180,000 | Nevada Title Las Vegas | |
| Corporate Deed | $45,900 | Fidelity National Title | |
| Interfamily Deed Transfer | -- | -- | |
| Corporate Deed | $321,200 | Fidelity National Title |
Mortgage History
| Date | Status | Loan Amount | Loan Type |
|---|---|---|---|
| Open | $130,000 | New Conventional | |
| Previous Owner | $214,200 | Unknown |
Source: Las Vegas REALTORS®
MLS Number: 2724281
APN: 125-19-510-029
Disclaimer: Certain information contained herein is derived from information provided by parties other than Homes.com. All information provided is deemed reliable, but is not guaranteed to be accurate and should be independently verified.
![]() The data relating to real estate for sale on this web site comes in part from the INTERNET DATA EXCHANGE Program of the Greater Las Vegas Association of REALTORS® MLS. Real estate listings held by brokerage firms other than this site owner are marked with the IDX logo. Information is deemed reliable but not guaranteed. Copyright 2025 of the Greater Las Vegas Association of REALTORS® MLS. All rights reserved.
The data relating to real estate for sale on this web site comes in part from the INTERNET DATA EXCHANGE Program of the Greater Las Vegas Association of REALTORS® MLS. Real estate listings held by brokerage firms other than this site owner are marked with the IDX logo. Information is deemed reliable but not guaranteed. Copyright 2025 of the Greater Las Vegas Association of REALTORS® MLS. All rights reserved.
- 9230 Wittig Ave
- 0 N Chieftain St
- 9157 Fish Tail Ave Unit 101
- 9177 Dazzle Accent Ct
- 9153 Dorrell Ln
- 9318 Apollo Heights Ave
- 9124 Craven Ave
- 6864 Armistead St
- 9417 Wisdom Valley Ave
- 7120 Bear Paw Creek St Unit 101
- 9068 Bushy Tail Ave Unit 103
- 9429 Quiet Valley Ave
- 9057 Stone Cabin Ct
- 9125 Ripple Ridge Ave Unit 102
- 9121 Ripple Ridge Ave Unit 101
- 9004 Snowtrack Ave
- 8993 Dorrell Ln
- 9148 Patrick Henry Ave
- 6758 Barrington Hills St
- 9116 Dancing Snow Ct Unit 101
- 9325 Dorrell Ln
- 9125 Fish Tail Ave Unit 102
- 7111 Cabin Fever St Unit 101
- 7127 Cabin Fever St Unit 102
- 9203 Bronze River Ave
- 9328 Longhorn Falls Ct
- 9025 Barnwell Ave
- 9056 Walker Lake Ct
- 8980 Dorrell Ln
- 8955 Mossy Hollow Ave
- 7305 Gentle Valley St
- 8957 Misty Mill Ct
- 7204 Amber Cascade Ct
- 7405 Delicious Ct
- 8933 Jennifer Anne Ave
- 6882 Relic St
- 6955 N Durango Dr Unit 2074
- 6955 N Durango Dr Unit 1060
- 6955 N Durango Dr Unit 1065
- 8929 Charles Thomas Ct