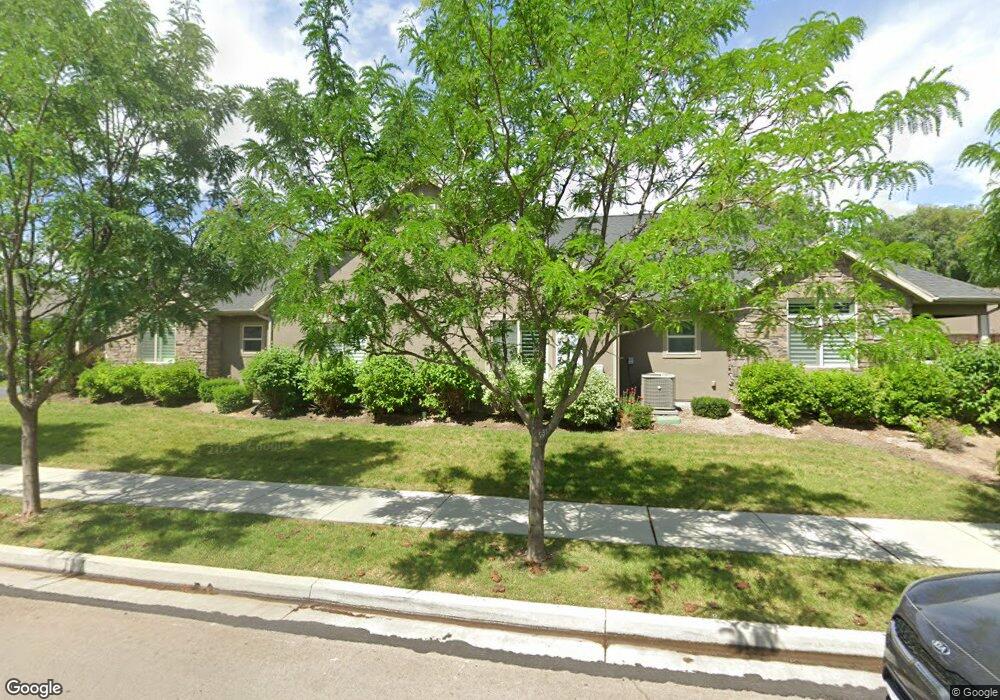
9232 S 2040 W Unit A West Jordan, UT 84088
Estimated Value: $567,000 - $665,000
3
Beds
3
Baths
2,110
Sq Ft
$286/Sq Ft
Est. Value
About This Home
This home is located at 9232 S 2040 W Unit A, West Jordan, UT 84088 and is currently estimated at $602,794, approximately $285 per square foot. 9232 S 2040 W Unit A is a home located in Salt Lake County with nearby schools including Westvale Elementary School, West Jordan Middle School, and West Jordan High School.
Ownership History
Date
Name
Owned For
Owner Type
Purchase Details
Closed on
Mar 18, 2022
Sold by
Hymas Darlene C
Bought by
Quist Carl David and Quist Diane G
Current Estimated Value
Home Financials for this Owner
Home Financials are based on the most recent Mortgage that was taken out on this home.
Original Mortgage
$888,000
Outstanding Balance
$873,261
Interest Rate
2.77%
Mortgage Type
Reverse Mortgage Home Equity Conversion Mortgage
Estimated Equity
-$270,467
Purchase Details
Closed on
Mar 16, 2022
Sold by
Hymas Darlene C
Bought by
Quist Carl David and Quist Diane G
Home Financials for this Owner
Home Financials are based on the most recent Mortgage that was taken out on this home.
Original Mortgage
$888,000
Outstanding Balance
$873,261
Interest Rate
2.77%
Mortgage Type
Reverse Mortgage Home Equity Conversion Mortgage
Estimated Equity
-$270,467
Purchase Details
Closed on
Jun 12, 2014
Sold by
Bridlewood Villas Inc
Bought by
Hymas W Merrill and Hymas Darlene C
Create a Home Valuation Report for This Property
The Home Valuation Report is an in-depth analysis detailing your home's value as well as a comparison with similar homes in the area
Home Values in the Area
Average Home Value in this Area
Purchase History
| Date | Buyer | Sale Price | Title Company |
|---|---|---|---|
| Quist Carl David | -- | Title Guarantee | |
| Quist Carl David | -- | Title Guarantee | |
| Quist Carl David | -- | Title Guarantee | |
| Hymas W Merrill | -- | Metro National Title |
Source: Public Records
Mortgage History
| Date | Status | Borrower | Loan Amount |
|---|---|---|---|
| Open | Quist Carl David | $888,000 | |
| Closed | Quist Carl David | $888,000 | |
| Closed | Quist Carl David | $888,000 |
Source: Public Records
Tax History Compared to Growth
Tax History
| Year | Tax Paid | Tax Assessment Tax Assessment Total Assessment is a certain percentage of the fair market value that is determined by local assessors to be the total taxable value of land and additions on the property. | Land | Improvement |
|---|---|---|---|---|
| 2025 | $130 | $608,700 | $135,100 | $473,600 |
| 2024 | $130 | $580,000 | $128,700 | $451,300 |
| 2023 | $3,016 | $523,100 | $119,200 | $403,900 |
| 2022 | $3,016 | $538,000 | $116,800 | $421,200 |
| 2021 | $2,676 | $434,500 | $93,500 | $341,000 |
| 2020 | $2,789 | $425,000 | $93,500 | $331,500 |
| 2019 | $2,787 | $416,500 | $93,500 | $323,000 |
| 2018 | $2,620 | $388,300 | $91,000 | $297,300 |
| 2017 | $2,466 | $363,900 | $91,000 | $272,900 |
| 2016 | $2,027 | $281,100 | $91,000 | $190,100 |
| 2015 | $1,979 | $267,600 | $121,300 | $146,300 |
| 2014 | $1,978 | $263,300 | $117,000 | $146,300 |
Source: Public Records
Map
Nearby Homes
- 9252 S 2040 W Unit D
- 1968 W 9270 S Unit C
- 2177 W 9240 S
- 2097 Jordan Villa Dr
- 9414 S 1980 W
- 2223 W Williamsburg Cir
- 2286 Williamsburg Cir
- 9496 S 1930 W
- 1753 Rylie Ann Cir
- 9511 S Tirado Cove Unit 204
- Brook Haven Plan at Jordan Woods
- Maple Plan at Jordan Woods
- The Maple Basement Plan at Jordan Woods
- The Evergreen Basement Plan at Jordan Woods
- 9503 S Tirado Cove Unit 203
- 1719 W Brocious Way Unit 301
- 1673 Peaceful Cir
- 9178 Lisa Ave
- 8859 S Long Dr
- 2041 W 8820 S
- 9232 S 2040 W Unit B
- 9252 S 2040 W Unit A
- 9252 S 2040 W Unit C
- 9212 S 2040 W Unit C
- 9212 S 2040 W Unit A
- 2097 W 9240 S
- 9213 S 2040 W Unit D
- 9272 S 2040 W Unit A
- 9272 S 2040 W Unit C
- 9272 S 2040 W Unit D
- 2116 W 9240 S
- 2116 W 9240 S Unit 1.13
- 2116 W 9240 S Unit 3
- 9233 S 2040 W Unit A
- 9233 S 2040 W Unit B
- 2018 W 9270 S Unit C
- 2115 W 9240 S
- 2115 W 9240 S Unit 3
- 2115 W 9240 S Unit 5
- 9234 S Covered Wagon Cir Unit B