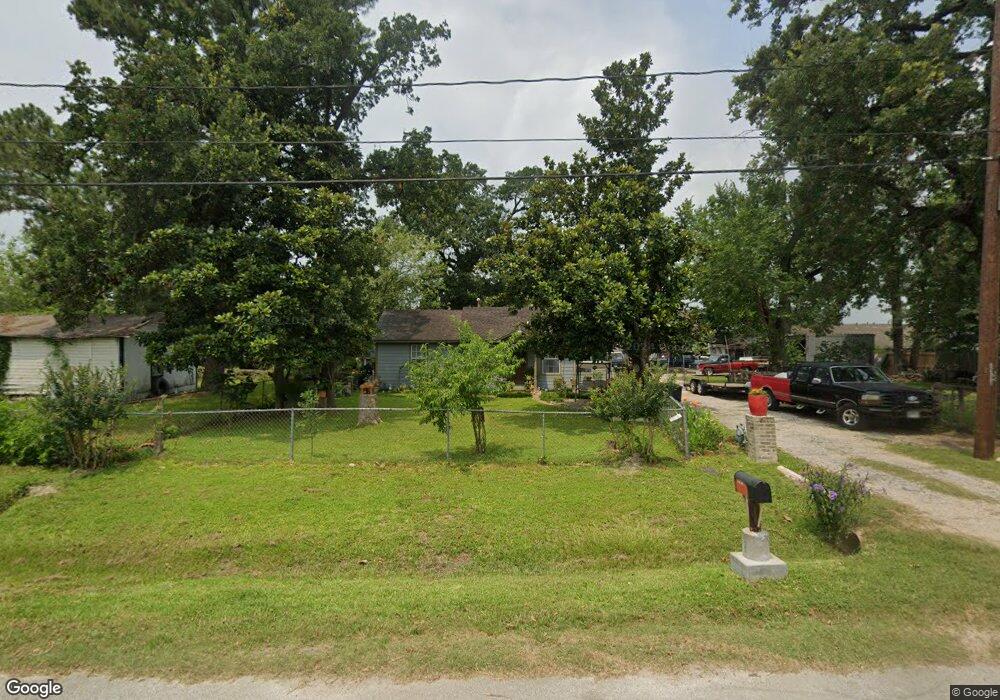
9233 Kelburn Dr Houston, TX 77016
Trinity-Houston Gardens NeighborhoodEstimated Value: $159,000 - $255,000
2
Beds
1
Bath
1,040
Sq Ft
$180/Sq Ft
Est. Value
About This Home
This home is located at 9233 Kelburn Dr, Houston, TX 77016 and is currently estimated at $187,312, approximately $180 per square foot. 9233 Kelburn Dr is a home located in Harris County with nearby schools including Shadydale Elementary School, Forest Brook Middle, and North Forest High School.
Ownership History
Date
Name
Owned For
Owner Type
Purchase Details
Closed on
Jan 6, 2021
Sold by
Maldonado Agapito T
Bought by
Maldonado Hernandez Maria G
Current Estimated Value
Purchase Details
Closed on
Dec 14, 2007
Sold by
Montano Heber and Montano Celia
Bought by
Maldonado Agapito T
Home Financials for this Owner
Home Financials are based on the most recent Mortgage that was taken out on this home.
Original Mortgage
$54,000
Outstanding Balance
$34,127
Interest Rate
6.27%
Mortgage Type
Purchase Money Mortgage
Estimated Equity
$153,185
Purchase Details
Closed on
May 9, 2003
Sold by
Arnold Dorothy June
Bought by
Montano Heber and Montano Celia
Home Financials for this Owner
Home Financials are based on the most recent Mortgage that was taken out on this home.
Original Mortgage
$59,858
Interest Rate
5.77%
Mortgage Type
FHA
Create a Home Valuation Report for This Property
The Home Valuation Report is an in-depth analysis detailing your home's value as well as a comparison with similar homes in the area
Home Values in the Area
Average Home Value in this Area
Purchase History
| Date | Buyer | Sale Price | Title Company |
|---|---|---|---|
| Maldonado Hernandez Maria G | -- | None Available | |
| Maldonado Agapito T | -- | Fidelity National Title | |
| Montano Heber | -- | Fidelity National Title |
Source: Public Records
Mortgage History
| Date | Status | Borrower | Loan Amount |
|---|---|---|---|
| Open | Maldonado Agapito T | $54,000 | |
| Previous Owner | Montano Heber | $59,858 |
Source: Public Records
Tax History Compared to Growth
Tax History
| Year | Tax Paid | Tax Assessment Tax Assessment Total Assessment is a certain percentage of the fair market value that is determined by local assessors to be the total taxable value of land and additions on the property. | Land | Improvement |
|---|---|---|---|---|
| 2025 | $3,484 | $167,741 | $100,800 | $66,941 |
| 2024 | $3,484 | $166,527 | $100,800 | $65,727 |
| 2023 | $3,484 | $140,446 | $75,600 | $64,846 |
| 2022 | $2,252 | $102,285 | $50,400 | $51,885 |
| 2021 | $1,847 | $79,242 | $33,600 | $45,642 |
| 2020 | $1,785 | $73,711 | $33,600 | $40,111 |
| 2019 | $1,621 | $64,062 | $26,880 | $37,182 |
| 2018 | $1,418 | $56,030 | $26,880 | $29,150 |
| 2017 | $1,417 | $56,030 | $26,880 | $29,150 |
| 2016 | $1,176 | $46,520 | $21,000 | $25,520 |
| 2015 | $1,057 | $41,110 | $19,320 | $21,790 |
| 2014 | $1,057 | $41,110 | $19,320 | $21,790 |
Source: Public Records
Map
Nearby Homes
- 9317 Homestead Rd
- 9227 Homestead Rd
- 9316 Sundown Dr
- 9412 Crofton St
- 0 Crofton St
- 9412 Firnat St Unit A-B
- 5009 Tidwell Rd
- 6110 Tidwell Rd
- 9205 & 9207 Spaulding St
- 9437 Pembrook St
- 8928 Homestead Rd
- 9313 Sherbourne St
- 9603 Homestead Rd
- 9318 Sherbourne St
- 8914 Lanewood Dr
- 9009 Compton St
- 9702 Crofton St
- 6226 E Tidwell Rd
- 6513 Laura Koppe Rd
- 6206 Antha St
- 9229 Kelburn Dr
- 9315 Kelburn Dr
- 9302 Homestead Rd
- 9232 Kelburn Dr
- 9236 Kelburn Dr
- 9221 Kelburn Dr
- 9317 Kelburn Dr Unit 1
- 9317 Kelburn Dr
- 9302 Kelburn Dr
- 9222 Homestead Rd
- 9319 Kelburn Dr
- 9319 Kelburn Dr
- 9319 Kelburn Dr Unit 1
- 9319 Kelburn Dr Unit 2
- 9217 Kelburn Dr
- 9308 Kelburn Dr
- 9222 Kelburn Dr
- 9312 Kelburn Dr
- 9213 Kelburn Dr
- 9221 Sundown Dr