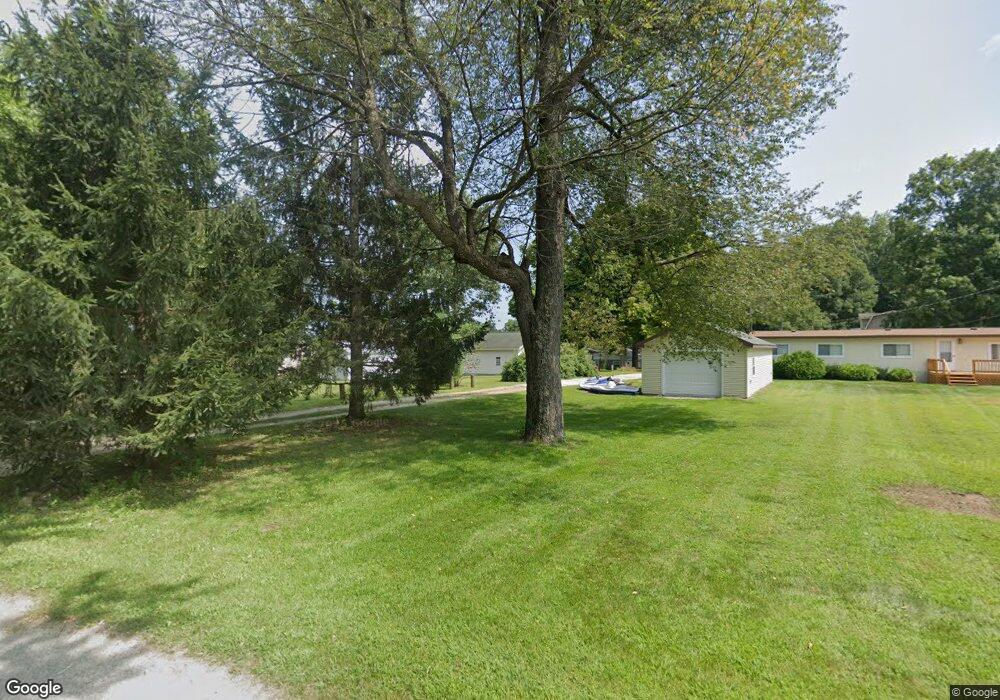
9236 Beech Dr Reading, MI 49274
Estimated Value: $159,000 - $229,000
Studio
--
Bath
750
Sq Ft
$238/Sq Ft
Est. Value
About This Home
This home is located at 9236 Beech Dr, Reading, MI 49274 and is currently estimated at $178,736, approximately $238 per square foot. 9236 Beech Dr is a home with nearby schools including Reynolds Elementary School and Reading High School.
Ownership History
Date
Name
Owned For
Owner Type
Purchase Details
Closed on
May 31, 2008
Sold by
Mercer Kevin and Miller Karyn
Bought by
Mercer Kevin and Miller Karyn
Current Estimated Value
Home Financials for this Owner
Home Financials are based on the most recent Mortgage that was taken out on this home.
Original Mortgage
$105,000
Interest Rate
6.01%
Mortgage Type
New Conventional
Purchase Details
Closed on
Aug 30, 2004
Sold by
Balogh Carol L and Ream Bonnie L
Bought by
Mercer Kevin and Miller Karyn
Home Financials for this Owner
Home Financials are based on the most recent Mortgage that was taken out on this home.
Original Mortgage
$79,600
Interest Rate
6.17%
Mortgage Type
Purchase Money Mortgage
Purchase Details
Closed on
Apr 6, 2000
Sold by
Balogh Julius
Bought by
Balogh Carol L
Purchase Details
Closed on
Sep 30, 1999
Sold by
Balogh Carol L
Bought by
Balogh Carol L
Purchase Details
Closed on
Feb 15, 1999
Sold by
Balogh Julius
Bought by
Balogh Julius
Create a Home Valuation Report for This Property
The Home Valuation Report is an in-depth analysis detailing your home's value as well as a comparison with similar homes in the area
Purchase History
| Date | Buyer | Sale Price | Title Company |
|---|---|---|---|
| Mercer Kevin | -- | Title First National | |
| Mercer Kevin | $99,000 | Transworld Title Company Llc | |
| Balogh Carol L | $100 | -- | |
| Balogh Carol L | $100 | -- | |
| Balogh Julius | -- | -- |
Source: Public Records
Mortgage History
| Date | Status | Borrower | Loan Amount |
|---|---|---|---|
| Closed | Mercer Kevin | $105,000 | |
| Closed | Mercer Kevin | $79,600 |
Source: Public Records
Tax History
| Year | Tax Paid | Tax Assessment Tax Assessment Total Assessment is a certain percentage of the fair market value that is determined by local assessors to be the total taxable value of land and additions on the property. | Land | Improvement |
|---|---|---|---|---|
| 2025 | $456 | $61,800 | $0 | $0 |
| 2024 | $4 | $61,400 | $0 | $0 |
| 2023 | $423 | $59,000 | $0 | $0 |
| 2022 | $1,603 | $49,400 | $0 | $0 |
| 2021 | $1,555 | $47,300 | $0 | $0 |
| 2020 | $1,549 | $46,700 | $0 | $0 |
| 2019 | $1,507 | $40,300 | $0 | $0 |
| 2018 | $1,449 | $37,500 | $0 | $0 |
| 2017 | $1,408 | $37,300 | $0 | $0 |
| 2016 | $1,396 | $37,200 | $0 | $0 |
| 2015 | $357 | $37,200 | $0 | $0 |
| 2013 | $346 | $31,970 | $0 | $0 |
| 2012 | -- | $31,600 | $0 | $0 |
Source: Public Records
Map
Nearby Homes
- 9222 Beech Dr
- 2408 Spruce Dr
- 8941 Kellogg Dr
- 9055 Kellogg Dr
- 9059 Kellogg Dr
- 8875 Kellogg Dr
- 1725 Hemlock Rd
- 3173 Tepee Dr
- 1750 Pierce Rd
- 3870 Rus Dic Dr
- 9180 Arkansaw Rd
- 4111 Blair Rd
- 5100 Long Lake Rd
- 5211 Long Lake Rd
- 5375 Paradise Dr
- 5482 Circle Dr
- 6331 Bacon Rd
- 0 Wildwood Rd
- 490 Kelley Rd
- 0 Long Lake Rd Unit 26458115
Your Personal Tour Guide
Ask me questions while you tour the home.