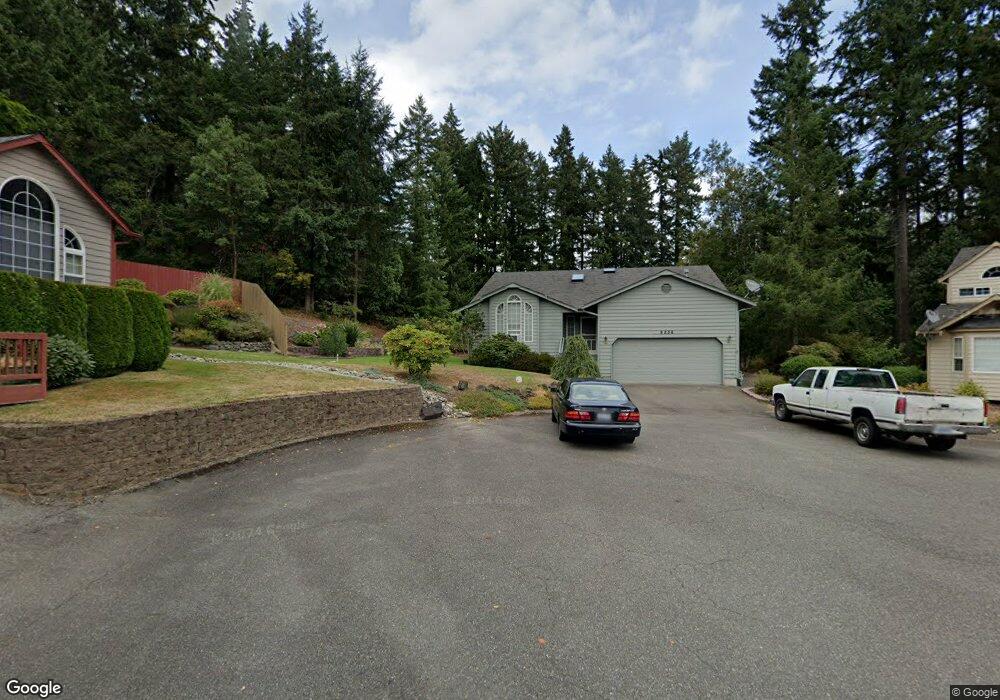
9236 Withers Place NW Bremerton, WA 98311
Estimated Value: $499,472 - $530,000
3
Beds
2
Baths
1,624
Sq Ft
$319/Sq Ft
Est. Value
About This Home
This home is located at 9236 Withers Place NW, Bremerton, WA 98311 and is currently estimated at $518,368, approximately $319 per square foot. 9236 Withers Place NW is a home located in Kitsap County with nearby schools including Silver Ridge Elementary School, Central Kitsap Middle School, and Central Kitsap High School.
Ownership History
Date
Name
Owned For
Owner Type
Purchase Details
Closed on
Sep 24, 2021
Sold by
Hoskinson Roberta E
Bought by
Hoskinson Roberta E
Current Estimated Value
Home Financials for this Owner
Home Financials are based on the most recent Mortgage that was taken out on this home.
Original Mortgage
$155,000
Outstanding Balance
$140,731
Interest Rate
2.8%
Mortgage Type
New Conventional
Estimated Equity
$377,637
Purchase Details
Closed on
Jan 11, 2010
Sold by
Hoskinson Thomas F and Hoskinson Roberta E
Bought by
Hoskinson Roberta E
Purchase Details
Closed on
Jan 3, 1995
Sold by
Erickson Custom Homes Inc
Bought by
Hoskinson Thomas F and Hoskinson Roberta E
Home Financials for this Owner
Home Financials are based on the most recent Mortgage that was taken out on this home.
Original Mortgage
$140,250
Interest Rate
9.27%
Mortgage Type
Assumption
Create a Home Valuation Report for This Property
The Home Valuation Report is an in-depth analysis detailing your home's value as well as a comparison with similar homes in the area
Home Values in the Area
Average Home Value in this Area
Purchase History
| Date | Buyer | Sale Price | Title Company |
|---|---|---|---|
| Hoskinson Roberta E | -- | Ticor Title Company | |
| Hoskinson Roberta E | -- | None Available | |
| Hoskinson Thomas F | $137,500 | Transamerica Title Ins Co |
Source: Public Records
Mortgage History
| Date | Status | Borrower | Loan Amount |
|---|---|---|---|
| Open | Hoskinson Roberta E | $155,000 | |
| Closed | Hoskinson Thomas F | $140,250 |
Source: Public Records
Tax History Compared to Growth
Tax History
| Year | Tax Paid | Tax Assessment Tax Assessment Total Assessment is a certain percentage of the fair market value that is determined by local assessors to be the total taxable value of land and additions on the property. | Land | Improvement |
|---|---|---|---|---|
| 2026 | $852 | $435,140 | $115,770 | $319,370 |
| 2025 | $852 | $435,140 | $115,770 | $319,370 |
| 2024 | $811 | $435,140 | $115,770 | $319,370 |
| 2023 | $1,620 | $422,190 | $128,600 | $293,590 |
| 2022 | $3,762 | $359,060 | $109,230 | $249,830 |
| 2021 | $3,631 | $330,010 | $99,940 | $230,070 |
| 2020 | $3,321 | $305,330 | $92,190 | $213,140 |
| 2019 | $3,176 | $282,830 | $85,220 | $197,610 |
| 2018 | $3,413 | $231,010 | $67,330 | $163,680 |
| 2017 | $2,969 | $231,010 | $67,330 | $163,680 |
| 2016 | $2,894 | $208,170 | $67,330 | $140,840 |
| 2015 | $2,771 | $208,170 | $67,330 | $140,840 |
| 2014 | -- | $196,750 | $67,330 | $129,420 |
| 2013 | -- | $196,750 | $67,330 | $129,420 |
Source: Public Records
Map
Nearby Homes
- 9155 Kristi Ct NW
- 9632 Windswept Ln NW
- 1135 NW Windy Beach Ln
- 9672 Long Point Ln NW
- 9656 Sandy Isle Ln NW
- 9388 Kristine Dr NW
- 910 NW Leisure Ln
- 9695 Spinnaker Blvd NW
- 1210 NW Huckle Dr
- 9310 Olson Rd NW
- 981 Mahogany Ln NW
- 563 NW Silver Glen Ln
- 9637 Fredrickson Rd NW
- 9428 Tracyton Blvd NW
- 1737 NW Chena Rd
- 305 NE Waaga Way
- 241 NE Watson Ct
- 679 NE Conifer Dr
- 1940 NW Rustling Fir Ln
- 10155 Royal Valley Rd NE
- 9231 Withers Place NW
- 9230 Withers Place NW
- 9225 Withers Place NW
- 9224 Withers Place NW
- 9254 Oneida Cir NW
- 9248 Oneida Cir NW
- 9460 Marissa Ln NW
- 0 Lot B Hamling Ln NW
- 9266 Oneida Cir NW
- 9219 Withers Place NW
- 9218 Withers Place NW
- 0 Lot A Hamling Ln NW
- 9242 Oneida Cir NW
- 9272 Oneida Cir NW
- 9478 Marissa Ln NW
- 9212 Withers Place NW
- 9213 Withers Place NW
- 9265 Oneida Cir NW
- 9575 Hamling Ln NW
- 9229 Mint Loop NW