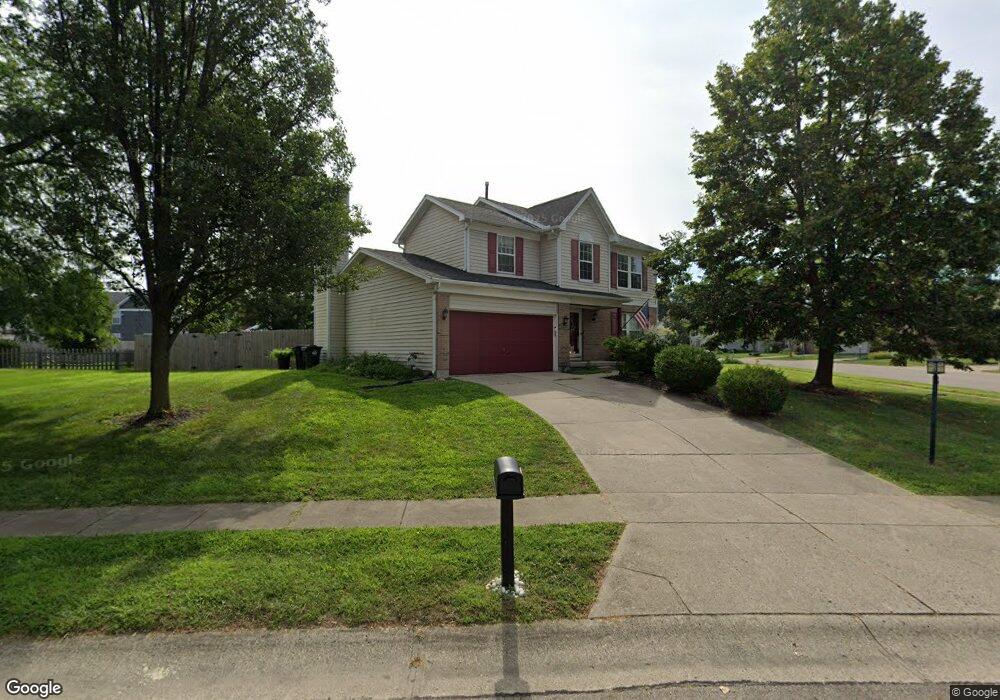
924 Carriage Ln Miamisburg, OH 45342
Estimated Value: $339,954 - $351,000
4
Beds
3
Baths
1,686
Sq Ft
$205/Sq Ft
Est. Value
About This Home
This home is located at 924 Carriage Ln, Miamisburg, OH 45342 and is currently estimated at $345,239, approximately $204 per square foot. 924 Carriage Ln is a home located in Montgomery County with nearby schools including Miamisburg High School, Bishop Leibold School, and Dayton Christian School.
Ownership History
Date
Name
Owned For
Owner Type
Purchase Details
Closed on
Sep 20, 2021
Sold by
Mcintyre Jesse P and Mcintyre Nicole S
Bought by
Hans Heather and Massey Bryan Keith
Current Estimated Value
Home Financials for this Owner
Home Financials are based on the most recent Mortgage that was taken out on this home.
Original Mortgage
$265,216
Outstanding Balance
$241,327
Interest Rate
2.8%
Mortgage Type
VA
Estimated Equity
$103,912
Purchase Details
Closed on
Jul 26, 2002
Sold by
Ball Tracy M and Ball Dannie W
Bought by
Wells Ii Robert S
Home Financials for this Owner
Home Financials are based on the most recent Mortgage that was taken out on this home.
Original Mortgage
$154,850
Interest Rate
6.7%
Purchase Details
Closed on
May 21, 2002
Sold by
Polanco Wilfredo A
Bought by
Polanco Tracy
Purchase Details
Closed on
Oct 18, 1993
Sold by
The Ryland Group Inc
Bought by
Polanco Wilfredo A and Polanco Tracy
Create a Home Valuation Report for This Property
The Home Valuation Report is an in-depth analysis detailing your home's value as well as a comparison with similar homes in the area
Home Values in the Area
Average Home Value in this Area
Purchase History
| Date | Buyer | Sale Price | Title Company |
|---|---|---|---|
| Hans Heather | $256,000 | Vantage Land Title | |
| Wells Ii Robert S | $163,000 | -- | |
| Polanco Tracy | -- | -- | |
| Polanco Wilfredo A | -- | -- |
Source: Public Records
Mortgage History
| Date | Status | Borrower | Loan Amount |
|---|---|---|---|
| Open | Hans Heather | $265,216 | |
| Previous Owner | Wells Ii Robert S | $154,850 |
Source: Public Records
Tax History Compared to Growth
Tax History
| Year | Tax Paid | Tax Assessment Tax Assessment Total Assessment is a certain percentage of the fair market value that is determined by local assessors to be the total taxable value of land and additions on the property. | Land | Improvement |
|---|---|---|---|---|
| 2024 | $5,983 | $97,140 | $19,550 | $77,590 |
| 2023 | $5,983 | $94,380 | $19,550 | $74,830 |
| 2022 | $4,977 | $66,130 | $14,700 | $51,430 |
| 2021 | $4,401 | $66,130 | $14,700 | $51,430 |
| 2020 | $4,398 | $66,130 | $14,700 | $51,430 |
| 2019 | $4,048 | $55,910 | $10,500 | $45,410 |
| 2018 | $4,061 | $55,910 | $10,500 | $45,410 |
| 2017 | $4,033 | $55,910 | $10,500 | $45,410 |
| 2016 | $3,840 | $51,290 | $10,500 | $40,790 |
| 2015 | $3,764 | $51,290 | $10,500 | $40,790 |
| 2014 | $3,764 | $51,290 | $10,500 | $40,790 |
| 2012 | -- | $57,240 | $13,300 | $43,940 |
Source: Public Records
Map
Nearby Homes
- 2279 Rosina Dr
- 1157 Bonniebrook Dr
- 736 Decker Dr
- 2141 Rosina Dr
- 712 Decker Dr
- 2127 Carrington Ln
- 3902 Augusta Rd
- 628 Jamestown Dr
- 9220 Sawgrass Dr
- 9228 Sawgrass Dr
- 1 Pendle Point
- 9539 Byers Rd
- 2475 Byers Ridge Dr
- 1834 Mellow Dr
- 1131 Castleton Ct
- 2434 Whisper Dr
- 2054 Prestwick Bend
- 1734 Rosina Dr
- 1350 Vista Ridge Dr
- 1984 Cruden Bay Way