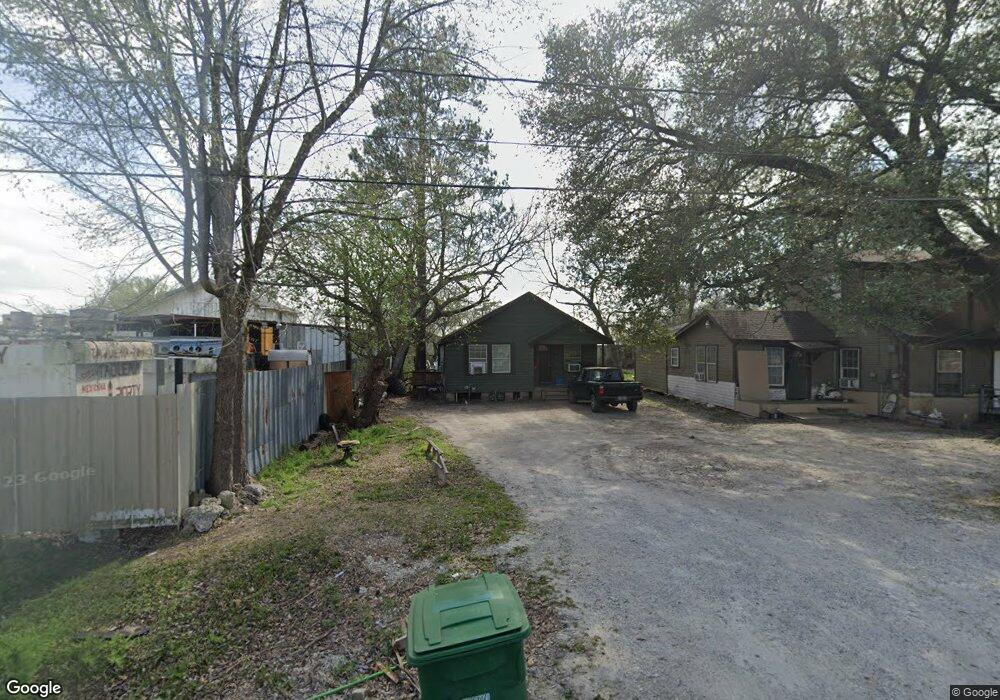
924 De Boll St Houston, TX 77022
Northside-Northline NeighborhoodEstimated Value: $274,757 - $338,000
3
Beds
3
Baths
2,678
Sq Ft
$110/Sq Ft
Est. Value
About This Home
This home is located at 924 De Boll St, Houston, TX 77022 and is currently estimated at $295,689, approximately $110 per square foot. 924 De Boll St is a home located in Harris County with nearby schools including Burbank Elementary School, Burbank Middle School, and Sam Houston Math, Science & Technology Center.
Ownership History
Date
Name
Owned For
Owner Type
Purchase Details
Closed on
Oct 11, 1999
Sold by
Hulsey David G
Bought by
Benitez Rogelio
Current Estimated Value
Home Financials for this Owner
Home Financials are based on the most recent Mortgage that was taken out on this home.
Original Mortgage
$50,000
Outstanding Balance
$15,132
Interest Rate
7.86%
Mortgage Type
Seller Take Back
Estimated Equity
$280,557
Create a Home Valuation Report for This Property
The Home Valuation Report is an in-depth analysis detailing your home's value as well as a comparison with similar homes in the area
Home Values in the Area
Average Home Value in this Area
Purchase History
| Date | Buyer | Sale Price | Title Company |
|---|---|---|---|
| Benitez Rogelio | -- | -- |
Source: Public Records
Mortgage History
| Date | Status | Borrower | Loan Amount |
|---|---|---|---|
| Open | Benitez Rogelio | $50,000 |
Source: Public Records
Tax History Compared to Growth
Tax History
| Year | Tax Paid | Tax Assessment Tax Assessment Total Assessment is a certain percentage of the fair market value that is determined by local assessors to be the total taxable value of land and additions on the property. | Land | Improvement |
|---|---|---|---|---|
| 2025 | $6,132 | $311,897 | $205,200 | $106,697 |
| 2024 | $6,132 | $293,057 | $188,325 | $104,732 |
| 2023 | $6,132 | $279,701 | $114,750 | $164,951 |
| 2022 | $5,393 | $244,919 | $114,750 | $130,169 |
| 2021 | $4,871 | $208,980 | $114,750 | $94,230 |
| 2020 | $4,467 | $184,468 | $114,750 | $69,718 |
| 2019 | $4,616 | $182,420 | $94,500 | $87,920 |
| 2018 | $3,723 | $147,124 | $78,975 | $68,149 |
| 2017 | $3,720 | $147,124 | $78,975 | $68,149 |
| 2016 | $3,540 | $140,005 | $74,250 | $65,755 |
| 2015 | $2,801 | $108,957 | $44,000 | $64,957 |
| 2014 | $2,801 | $108,957 | $44,000 | $64,957 |
Source: Public Records
Map
Nearby Homes
- 807 Firnat St
- 1207 Firnat St
- 723 Doverside St
- 702 Pennington St
- 9026 Mcgallion Rd
- 1104 Charnwood St
- 88 Berry Rd
- 8411 Berry Brush Ln
- 8402 Berry Green Ln
- 318 Charlock St
- 802 Berry Sage Ln
- 411 Berry Rd
- 253 De Boll St
- 249 De Boll St
- 8205 Appleton St
- 631 Apache St
- 216 Burress St
- 743 Apache St
- 415 Briarcliff Dr
- 714 Apache St
- 922 De Boll St
- 920 De Boll St
- 9019 Irvington Blvd
- 9011 Irvington Blvd
- 9101 Irvington Blvd
- 915 De Boll St
- 919 De Boll St
- 908 De Boll St
- 923 De Boll St
- 913 De Boll St
- 9107 Irvington Blvd Unit 1
- 903 Firnat St
- 903 Firnat St
- 820 De Boll St
- 911 De Boll St
- 826 Hohl St
- 812 1/2 De Boll St
- 9104 Irvington Blvd
- 821 De Boll St
- 8929 Irvington Blvd