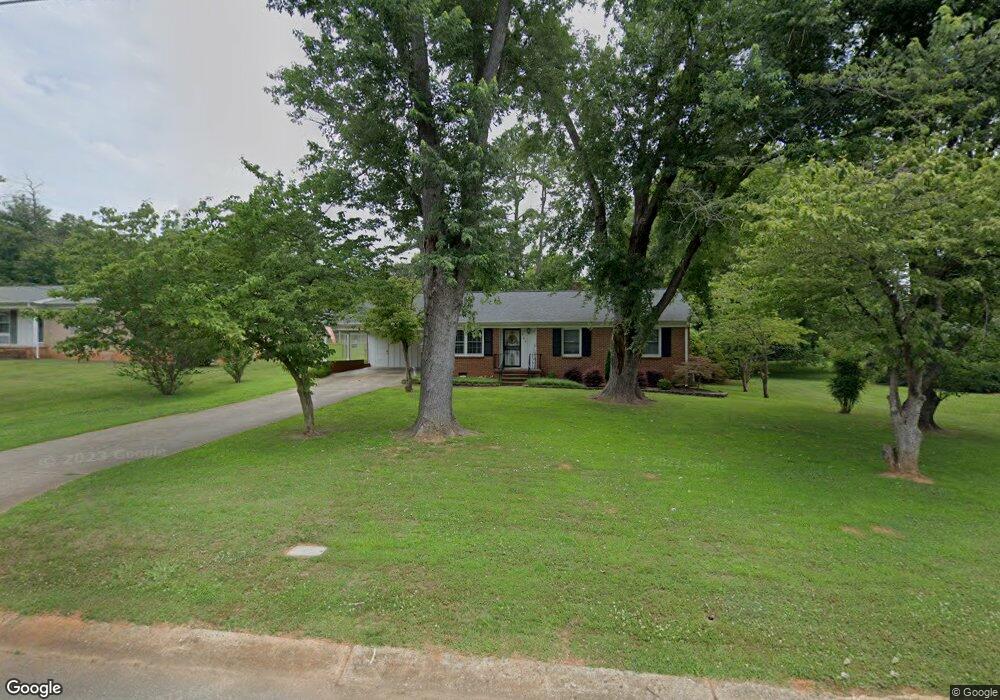
924 Eastview St Shelby, NC 28152
Estimated Value: $177,009 - $269,000
--
Bed
--
Bath
1,604
Sq Ft
$139/Sq Ft
Est. Value
About This Home
This home is located at 924 Eastview St, Shelby, NC 28152 and is currently estimated at $222,752, approximately $138 per square foot. 924 Eastview St is a home located in Cleveland County with nearby schools including Graham Elementary School, James Love Elementary School, and Shelby Middle School.
Create a Home Valuation Report for This Property
The Home Valuation Report is an in-depth analysis detailing your home's value as well as a comparison with similar homes in the area
Home Values in the Area
Average Home Value in this Area
Tax History Compared to Growth
Tax History
| Year | Tax Paid | Tax Assessment Tax Assessment Total Assessment is a certain percentage of the fair market value that is determined by local assessors to be the total taxable value of land and additions on the property. | Land | Improvement |
|---|---|---|---|---|
| 2025 | $1,882 | $189,127 | $15,724 | $173,403 |
| 2024 | $1,193 | $96,940 | $11,793 | $85,147 |
| 2023 | $1,187 | $96,940 | $11,793 | $85,147 |
| 2022 | $1,187 | $96,940 | $11,793 | $85,147 |
| 2021 | $1,193 | $96,940 | $11,793 | $85,147 |
| 2020 | $891 | $69,954 | $9,828 | $60,126 |
| 2019 | $891 | $69,954 | $9,828 | $60,126 |
| 2018 | $890 | $69,954 | $9,828 | $60,126 |
| 2017 | $868 | $69,954 | $9,828 | $60,126 |
| 2016 | $870 | $69,954 | $9,828 | $60,126 |
| 2015 | $1,219 | $103,891 | $10,810 | $93,081 |
| 2014 | $1,219 | $103,891 | $10,810 | $93,081 |
Source: Public Records
Map
Nearby Homes