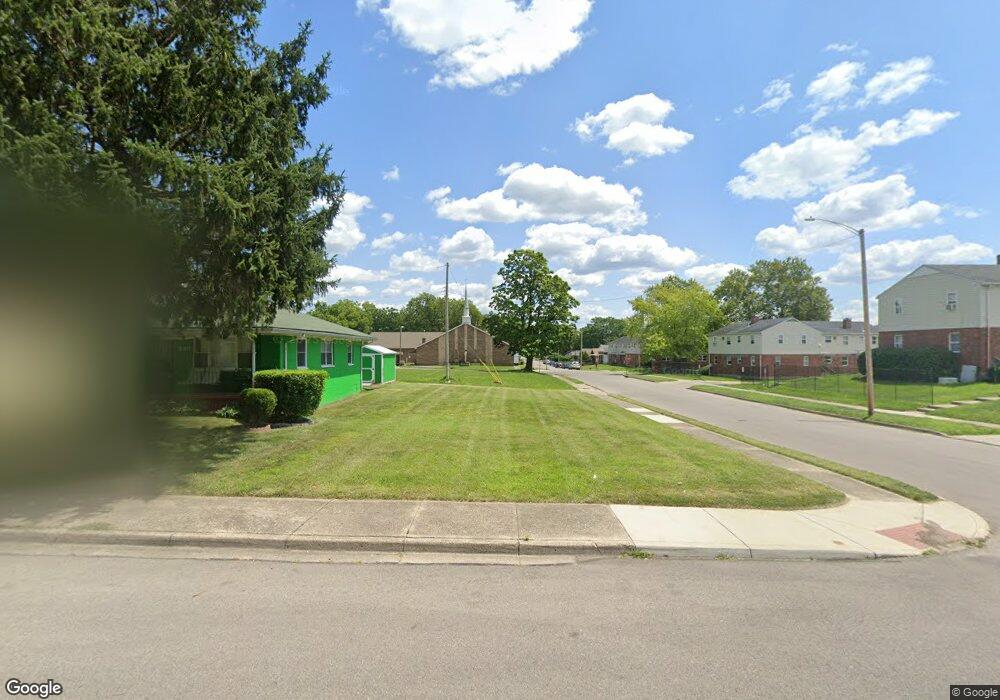
924 Frizell Ave Dayton, OH 45417
Edgemont NeighborhoodEstimated Value: $42,687 - $58,000
1
Bed
1
Bath
576
Sq Ft
$87/Sq Ft
Est. Value
About This Home
This home is located at 924 Frizell Ave, Dayton, OH 45417 and is currently estimated at $50,344, approximately $87 per square foot. 924 Frizell Ave is a home located in Montgomery County with nearby schools including International School at Residence Park, Louise Troy Elementary, and Westwood Elementary.
Ownership History
Date
Name
Owned For
Owner Type
Purchase Details
Closed on
Feb 1, 2019
Sold by
Montgomery County Land Reutilization Cor
Bought by
Jackson Wade Henry
Current Estimated Value
Purchase Details
Closed on
May 12, 2017
Sold by
Johnson Quinton
Bought by
Montgomery County Land Reutilization Cor
Purchase Details
Closed on
Sep 26, 2016
Sold by
Complimentary Service
Bought by
Johnson Quinton
Purchase Details
Closed on
Dec 8, 2015
Sold by
Scearce John
Bought by
Searce Complimantary
Purchase Details
Closed on
Feb 14, 2015
Sold by
Taylor Shanin L
Bought by
Scearce John
Purchase Details
Closed on
Mar 28, 2002
Sold by
Leon Jackson Jerry and Jackson Lelia
Bought by
Taylor Shanin L
Purchase Details
Closed on
Oct 22, 1998
Sold by
Mary Starks
Bought by
Jackson Jerry Leon
Purchase Details
Closed on
Oct 16, 1998
Sold by
Estate Of Salithiel Williams
Bought by
Starks Mary
Purchase Details
Closed on
Jun 1, 1997
Sold by
Jackson Jerry Leon
Bought by
Starks Mary and Williams Solitheal
Create a Home Valuation Report for This Property
The Home Valuation Report is an in-depth analysis detailing your home's value as well as a comparison with similar homes in the area
Home Values in the Area
Average Home Value in this Area
Purchase History
| Date | Buyer | Sale Price | Title Company |
|---|---|---|---|
| Jackson Wade Henry | -- | None Available | |
| Montgomery County Land Reutilization Cor | -- | None Available | |
| Johnson Quinton | $14,600 | None Available | |
| Searce Complimantary | -- | None Available | |
| Scearce John | $14,600 | None Available | |
| Taylor Shanin L | $19,500 | -- | |
| Jackson Jerry Leon | $3,500 | -- | |
| Jackson Jerry Leon | $3,500 | -- | |
| Starks Mary | -- | -- | |
| Starks Mary | $1,500 | -- |
Source: Public Records
Tax History Compared to Growth
Tax History
| Year | Tax Paid | Tax Assessment Tax Assessment Total Assessment is a certain percentage of the fair market value that is determined by local assessors to be the total taxable value of land and additions on the property. | Land | Improvement |
|---|---|---|---|---|
| 2024 | $86 | $1,490 | $1,490 | -- |
| 2023 | $86 | $1,490 | $1,490 | $0 |
| 2022 | $132 | $1,490 | $1,490 | $0 |
| 2021 | $23 | $1,490 | $1,490 | $0 |
| 2020 | $23 | $1,490 | $1,490 | $0 |
| 2019 | $37 | $1,490 | $1,490 | $0 |
| 2018 | $273 | $5,100 | $1,490 | $3,610 |
| 2017 | $37 | $5,100 | $1,490 | $3,610 |
| 2016 | $481 | $5,100 | $1,490 | $3,610 |
| 2015 | $971 | $5,100 | $1,490 | $3,610 |
| 2014 | $971 | $5,100 | $1,490 | $3,610 |
| 2012 | -- | $10,490 | $1,820 | $8,670 |
Source: Public Records
Map
Nearby Homes
- 830 S Euclid Ave
- 1127 Danner Ave
- 723 S Euclid Ave Unit 721
- 1306 Danner Ave
- 705 Clement Ave
- 1337 Danner Ave
- 1244 S Broadway St Unit 1242
- 1248 S Broadway St Unit 1246
- 508 S Paul Laurence Dunbar St
- 724 Dennison Ave
- 809 Dennison Ave
- 1024 Randolph St
- 403 S Euclid Ave
- 401 S Euclid Ave Unit 403
- 121 Gordon Ave
- 40 Gordon Ave
- 493 S Kilmer St
- 1515 Ingomar Ave
- 1027 Haller Ave
- 66 Barnett St Unit 64
- 920 Frizell Ave
- 916 Frizell Ave
- 908 Frizell Ave
- 929 S Euclid Ave
- 925 Frizell Ave
- 917 Frizell Ave
- 909 Frizell Ave
- 905 Frizell Ave
- 924 Danner Ave
- 0 Danner Ave
- 901 S Euclid Ave
- 918 Danner Ave
- 920 S Euclid Ave
- 901 Frizell Ave
- 900 Danner Ave
- 844 Frizell Ave
- 863 S Euclid Ave
- 927 Conners St
- 923 Conners St
- 841 Frizell Ave